Complete Solutions to Liquid Solutions of chapter GRAPHICAL INTERPRETATION of Class 12 book with complete answers and questions
| Class 12 | CHEMISTRY |
| Chapter | GRAPHICAL INTERPRETATION |
| GRB PUBLICATION | Liquid Solutions |
| Number Of Questions | 12 |
| Academic Year | 2023-24 |
The plots of `(1)/(x_(A))` (on y-axis) `(1)/(y_(A))` (on x-axis) is linear with slope and intercept respectively.
`p^(@)A =` vapour pressure of pure liquid A
`p^(@)B =` vapour pressure of pure liquid B
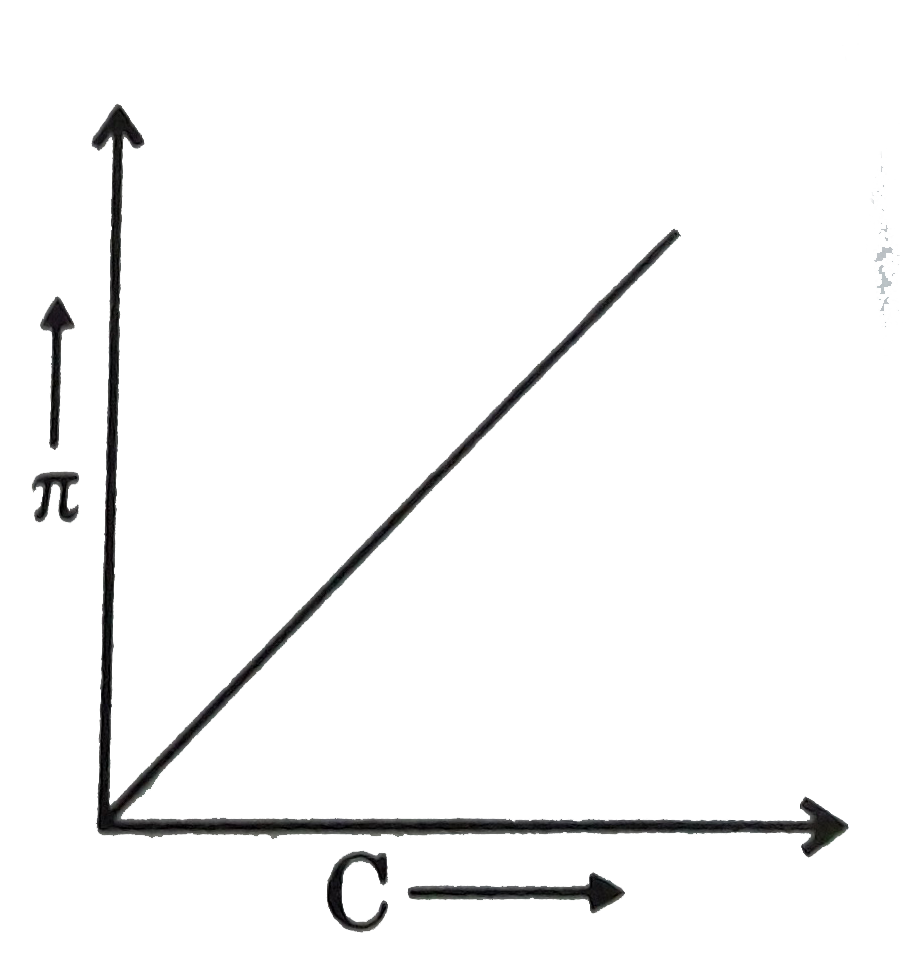
View SolutionA graph showing variation of osmotic pressure `(pi)` versus molar concentration. C of an aqueous solution at temperature T is given below. The slope of the line is equal to:
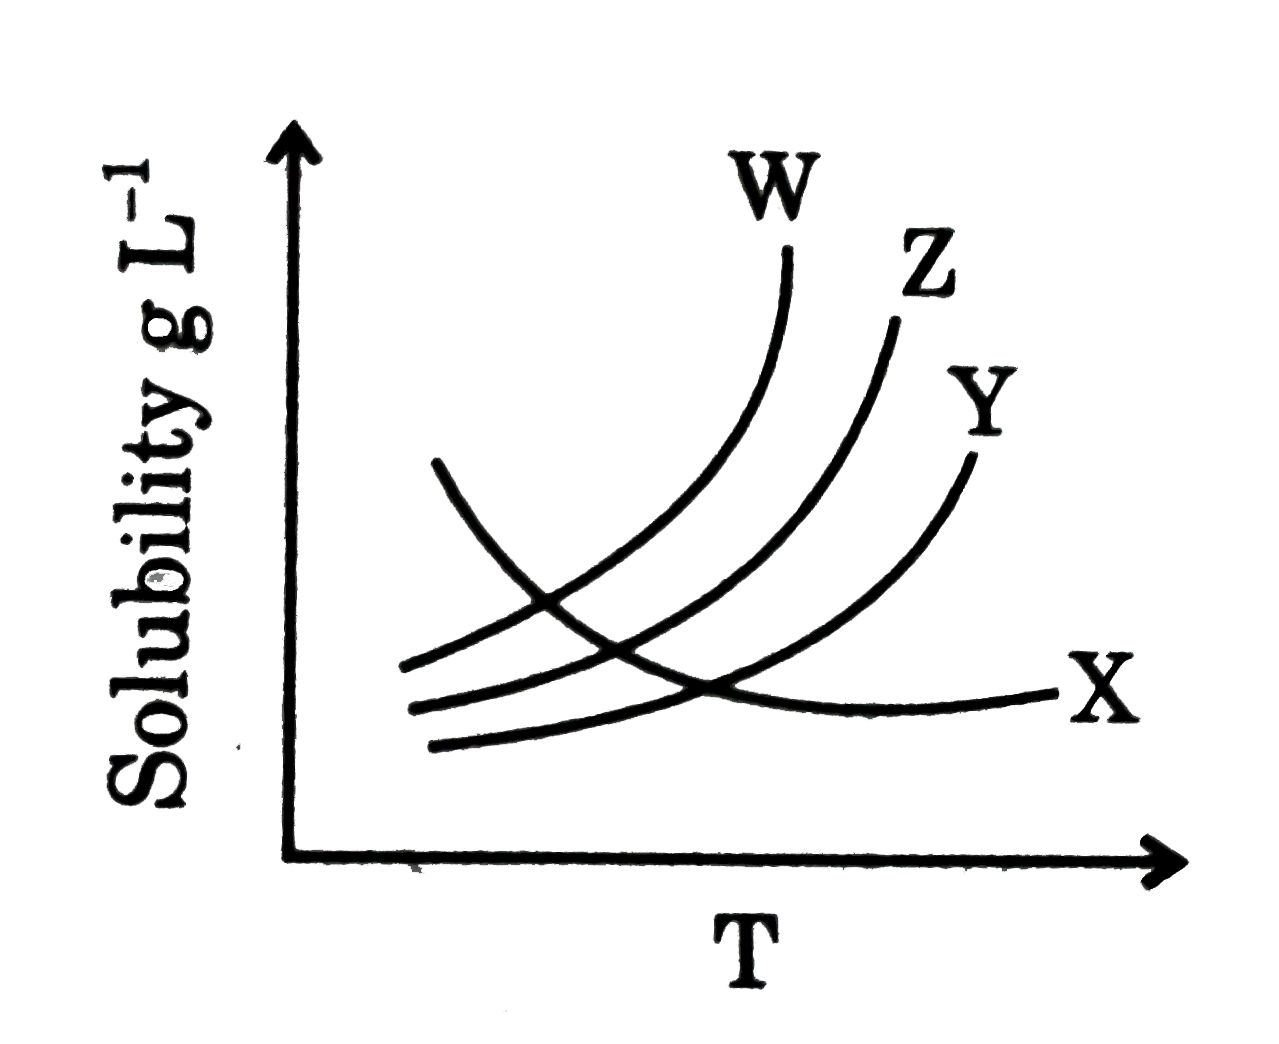
View SolutionSolubility curves of four ionic salts `X,Y,Z,W` are given below. In which case the value of `DeltaH_(sol) lt 0`?
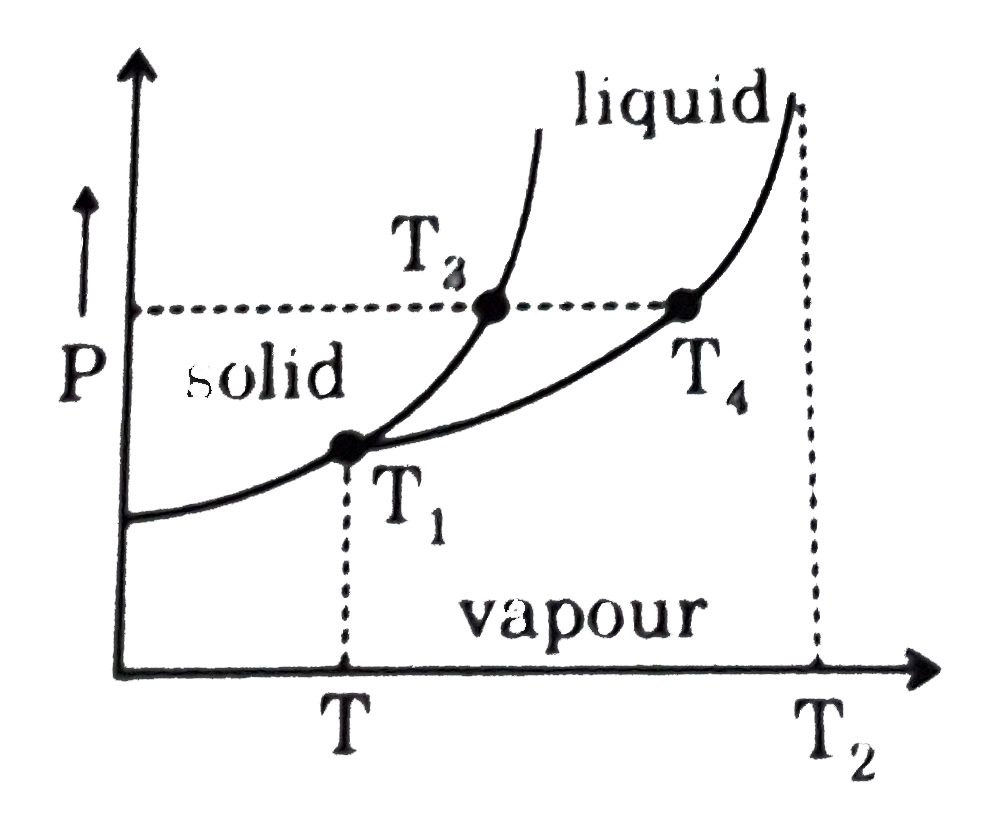
View SolutionObserve the P-T phase diagram for a given substance A. Then melting point of `A(s)`, boiling point of `A(l)`, critical point of A and triple point of A (at their respective pressure) are respectively:
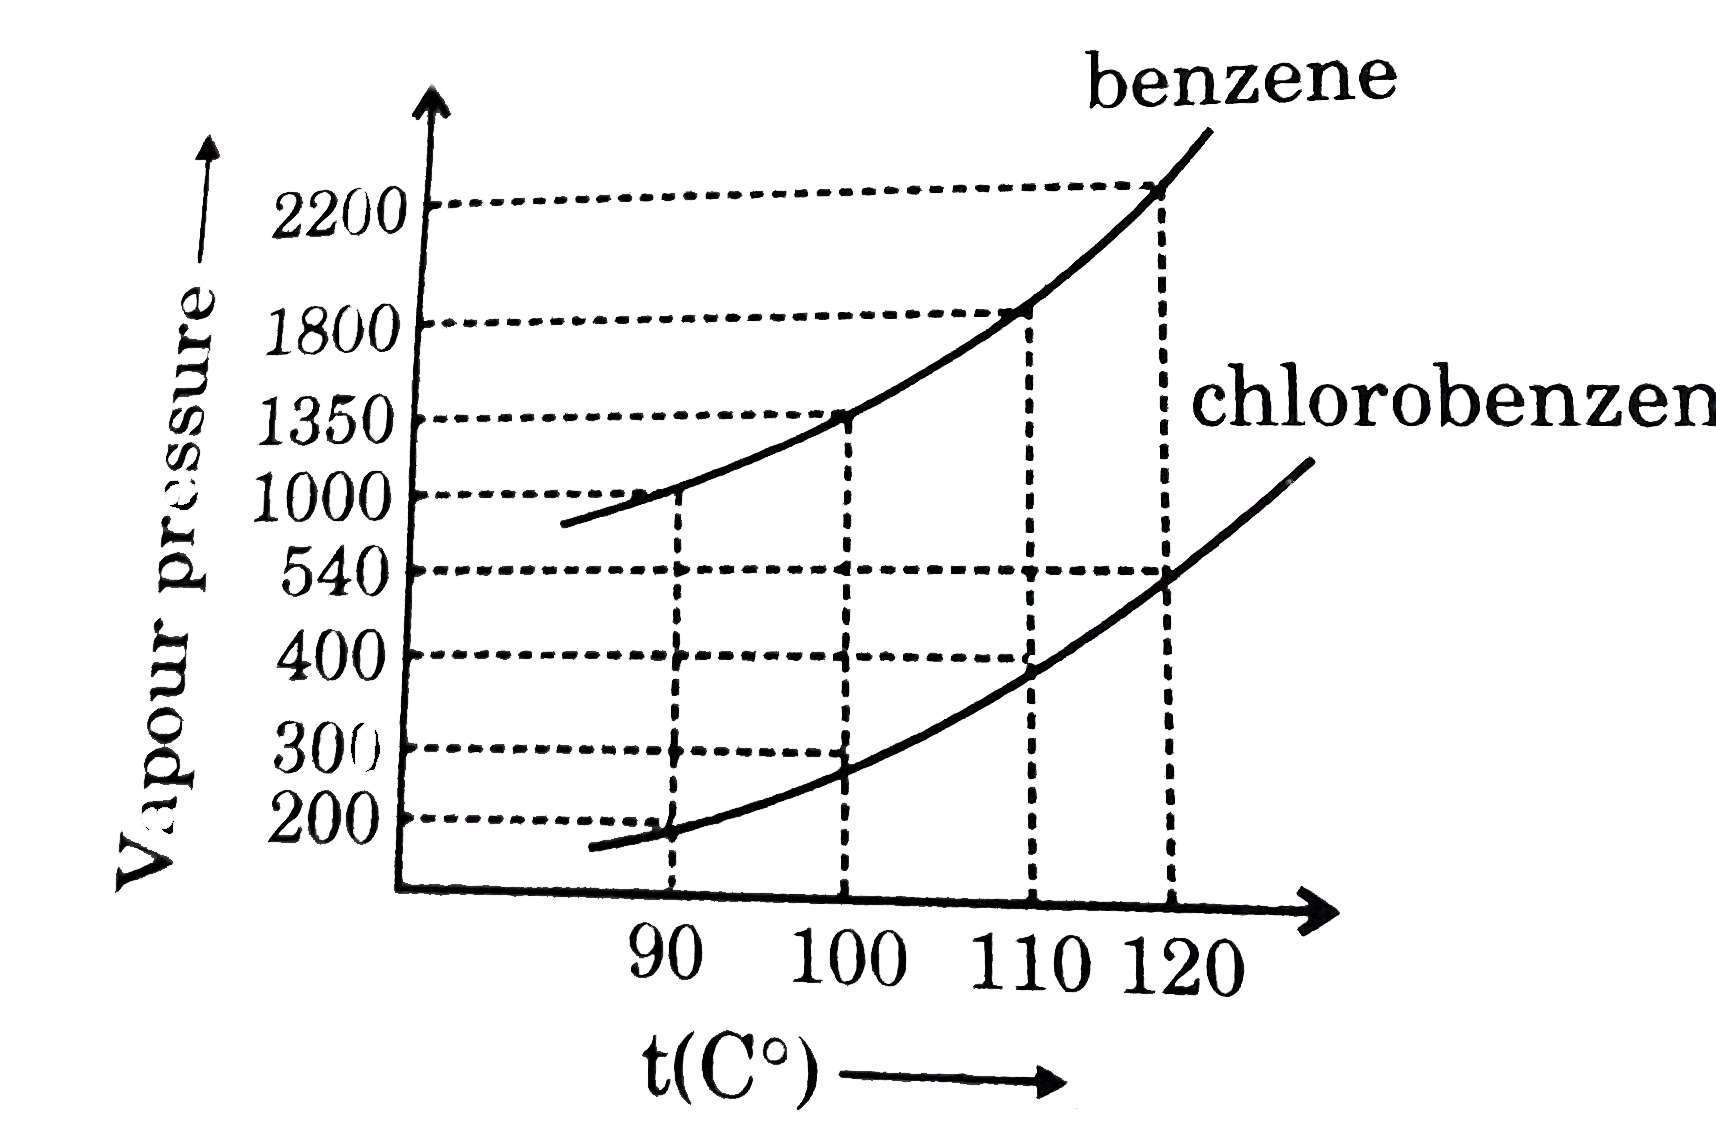
View SolutionAssuming the formation of an ideal solution, determine the boiling point of a mixture containing 1560 g benzene (molar mass = 78) and 1125 g chlorobenzene (molar mass = 112.5) using the following against an external pressure of 1000 torr.
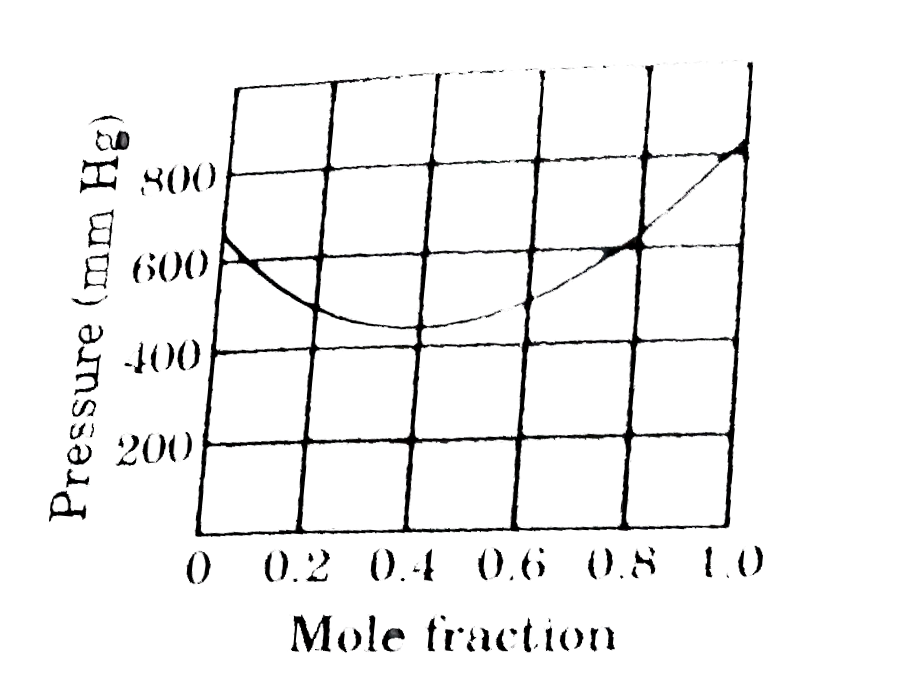
View SolutionGiven P-X curve for a non-ideal liquid mixture (fig). Identify the correct T-X curve for the same mixture.
View Solution`HNO_(3)` is more volatile than water. If an aqueous solution of `HNO_(3)` is taken then which of the following graph correctly represents variation of vapour pressure/boiling point with composition?
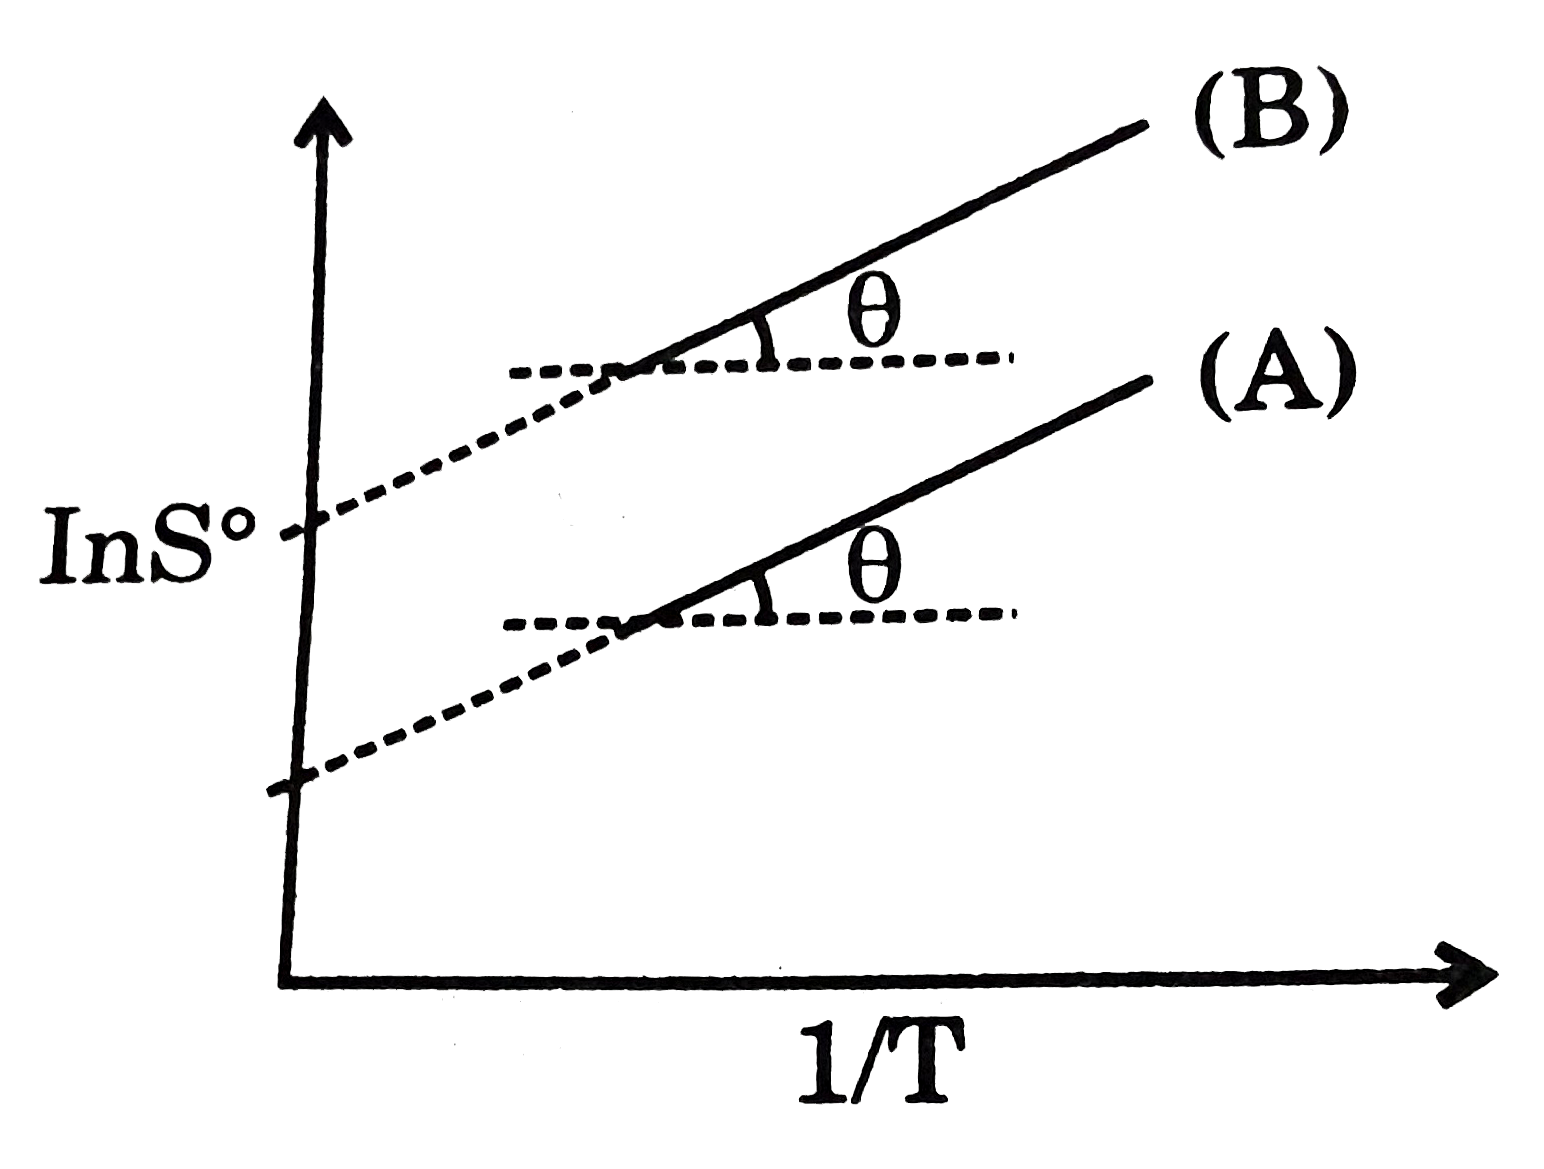
View SolutionGraph of ln `S^(@)` vs `(1)/(T)` is plotted for two gases A and B `[S^(@)` represents solubility in molarity and T is in Kelvin]. Compare Henry's constant `K_(H)` for the two gases at same temperature.
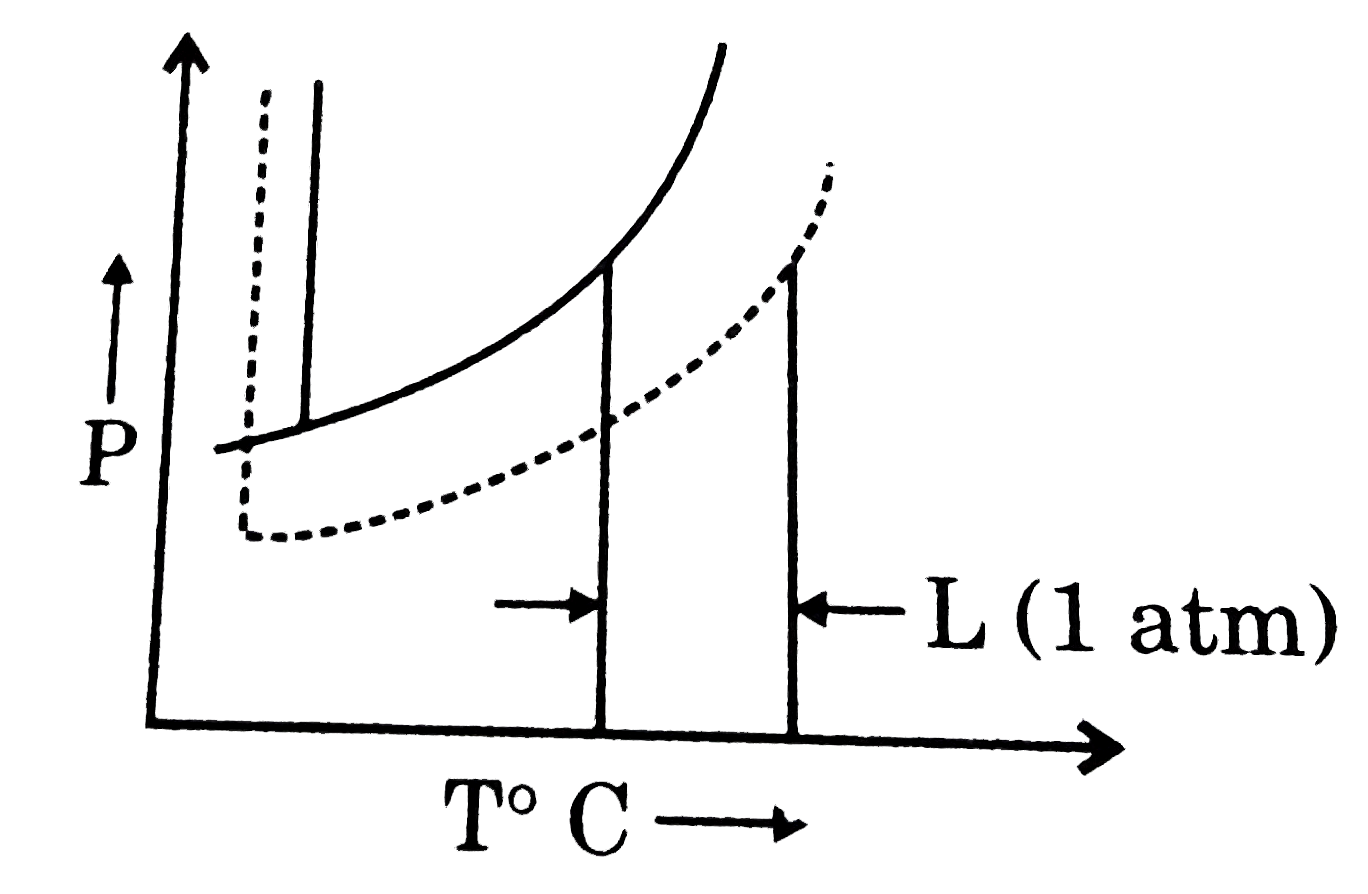
View SolutionThe phase diagrams for the pure solvent (solid lines) and the solution (non-volatile solute, dashed line) are recorded below. The quantity indicated by L in the figure is:
View SolutionWhat is the normal boiling point of the solution represented by the phase diagram ?
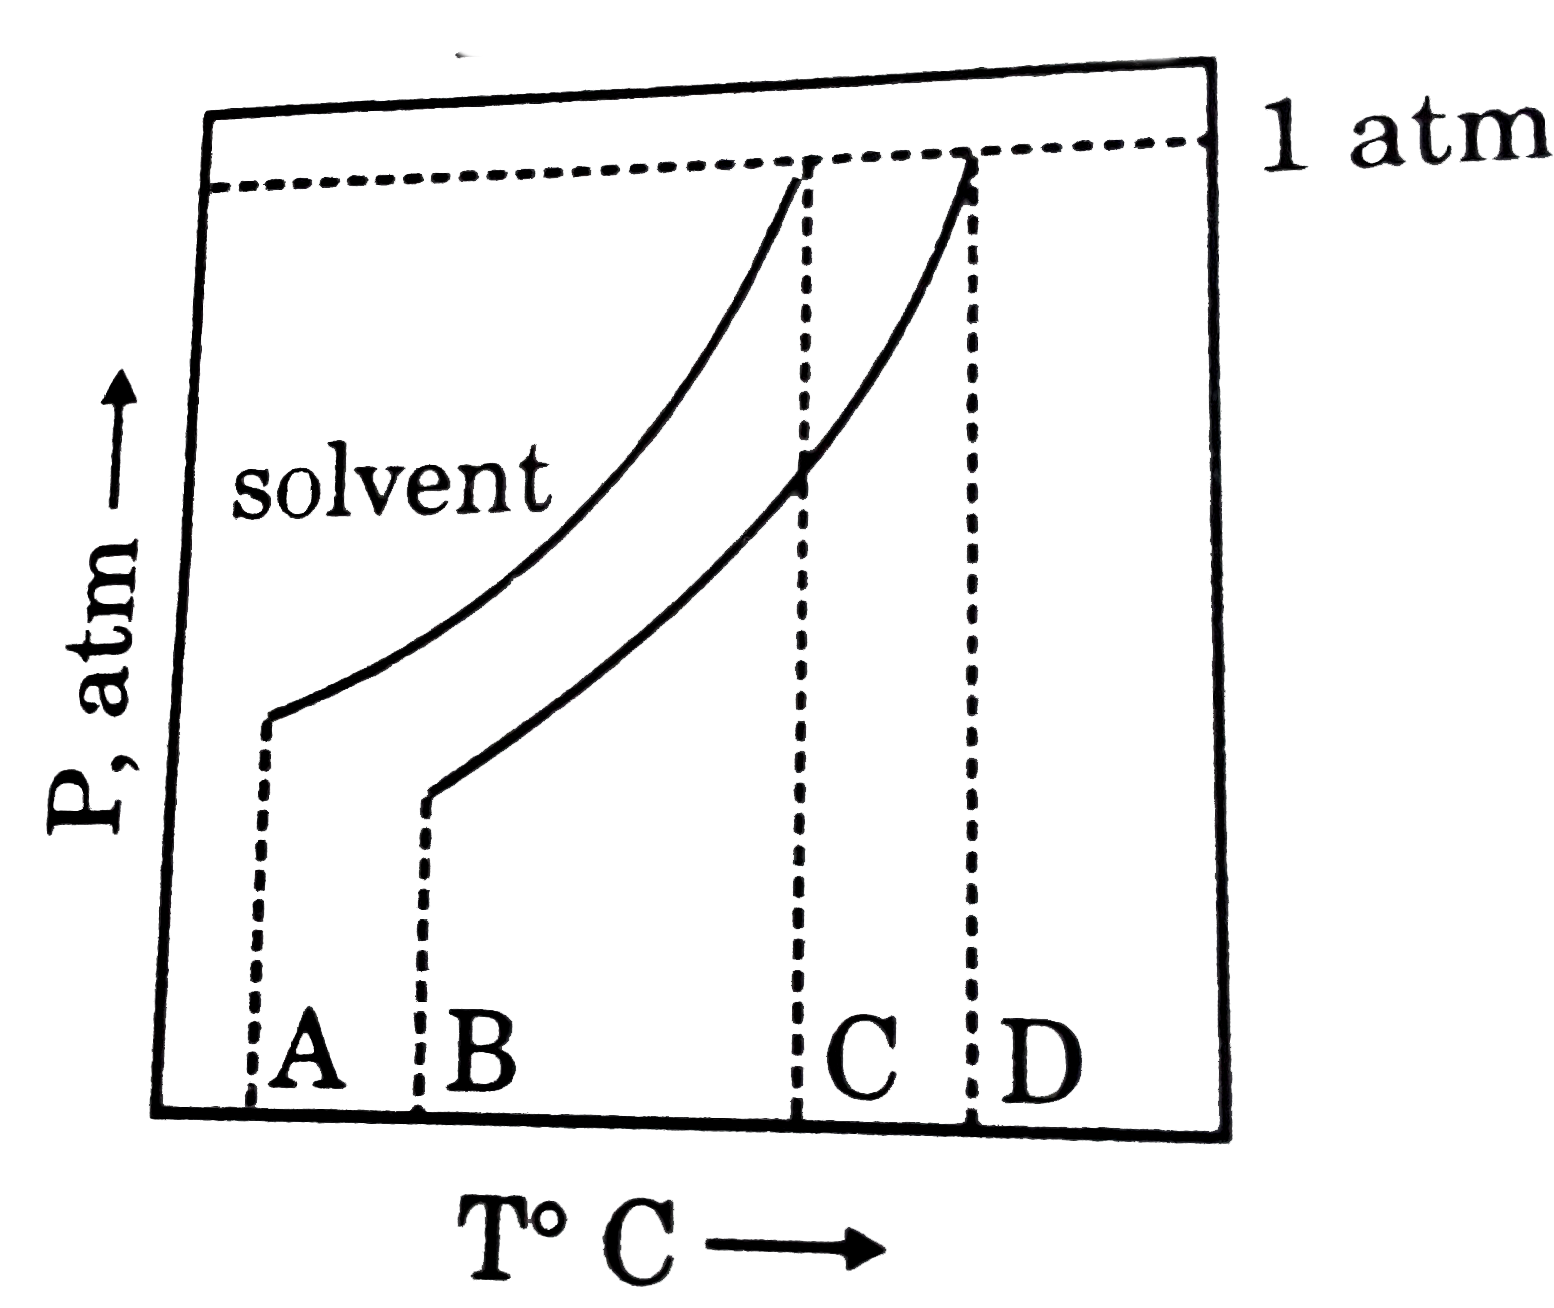
View SolutionWhat is the normal freezing point of the solution represented by the phase diagram ?
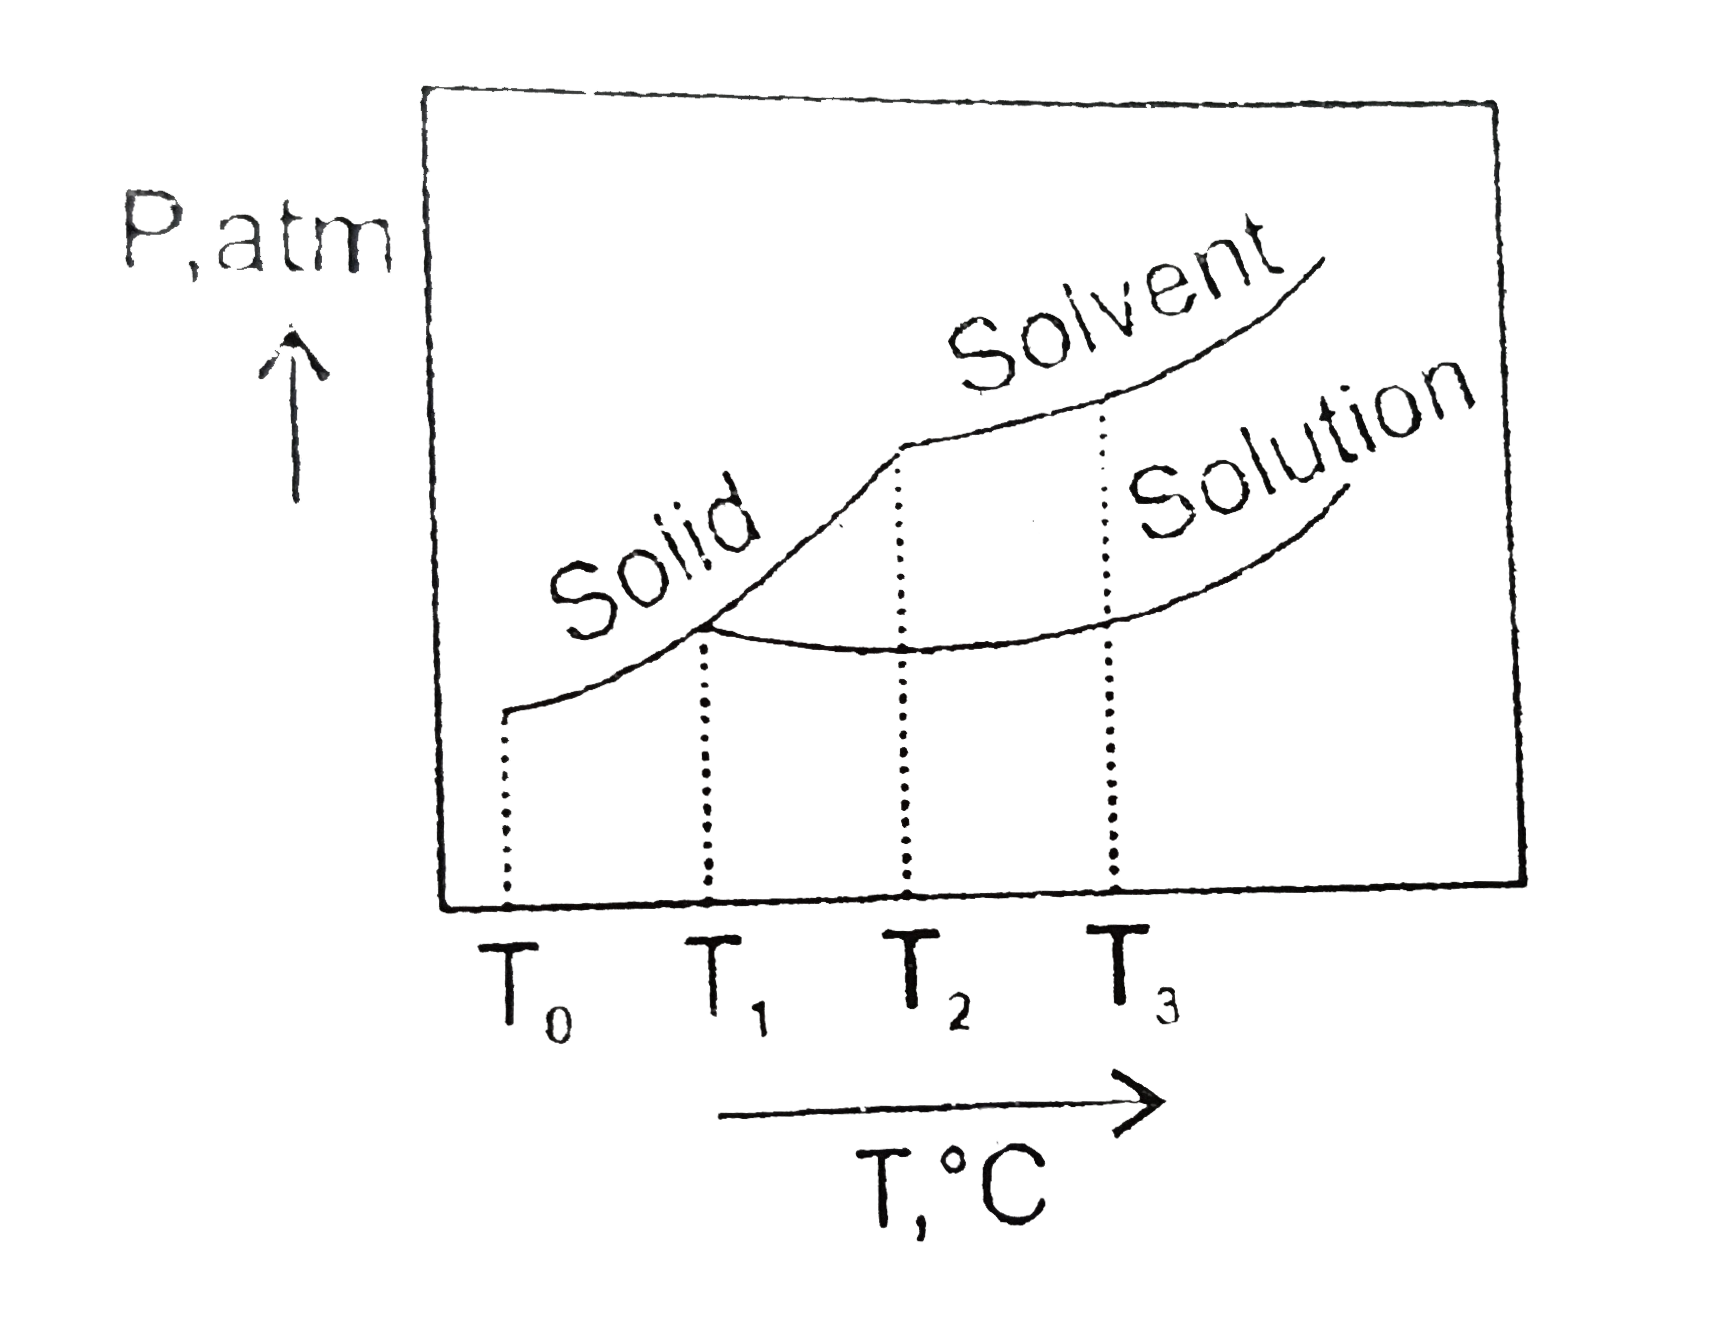
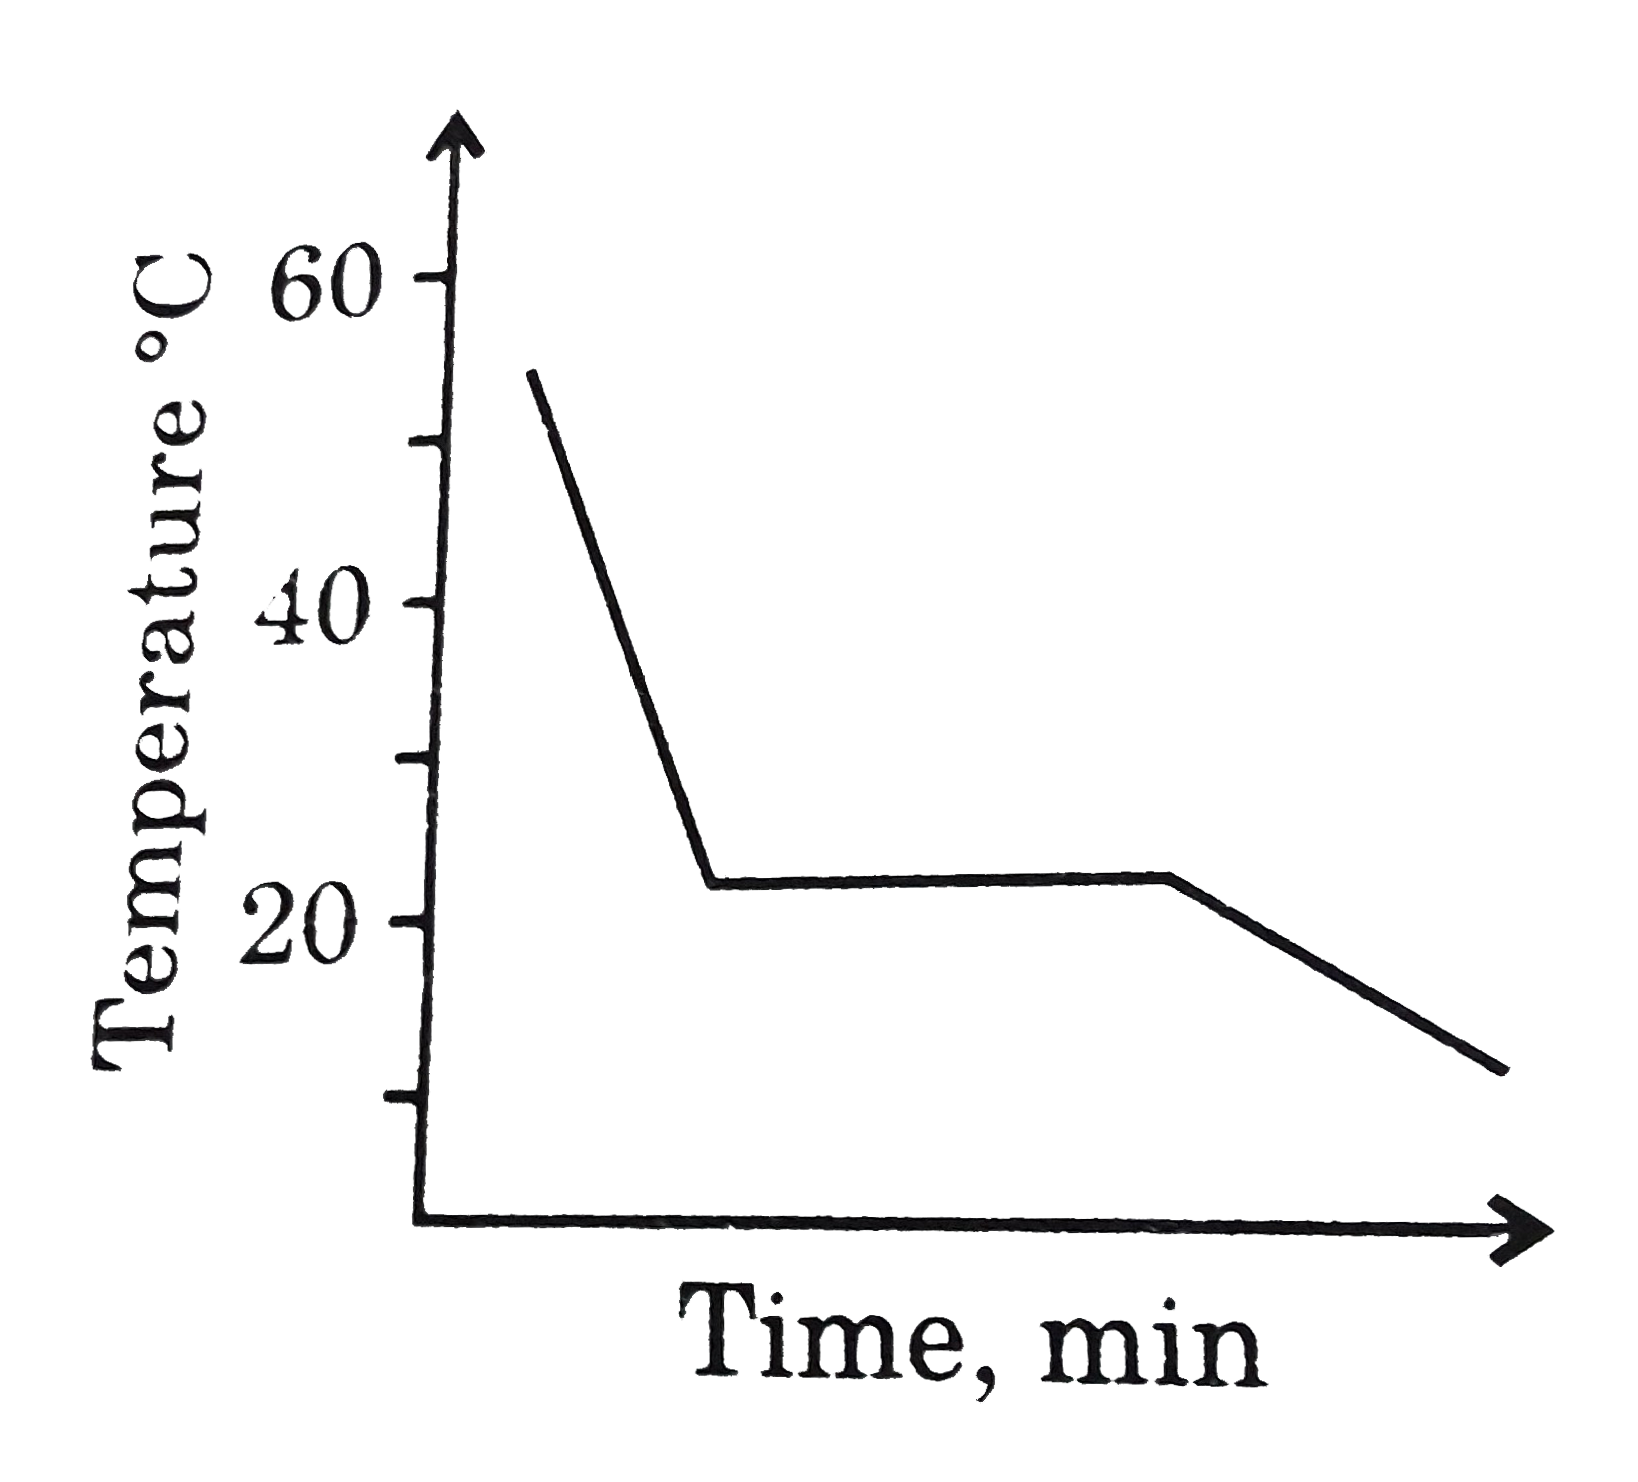
View SolutionThis diagram represents the behaviour of a pure solvent upon cooling. Which of the diagrams below best represents the cooling curve of a solution in that solvent upon cooling ? (Assume that all diagrams are drawn to the same scale.)
View Solution
Liquid Solutions questions and complete solutions for chapter GRAPHICAL INTERPRETATION of GRB CHEMISTRY (HINGLISH) of Class 12
All Exercises from GRB PUBLICATION Class 12 CHEMISTRY GRAPHICAL INTERPRETATION
- A. Thermodynamics
- Atomic Sturcture
- B. Gaseous State
- C. Atomic Sturcture
- Chemical Equilibrium
- Chemical Kinetics
- Comprehension
- Comprehension 1
- Comprehension 10
- Comprehension 11
- Comprehension 12
- Comprehension 13
- Comprehension 14
- Comprehension 15
- Comprehension 16
- Comprehension 17
- Comprehension 18
- Comprehension 19
- Comprehension 2
- Comprehension 20
- Comprehension 21
- Comprehension 22
- Comprehension 23
- Comprehension 24
- Comprehension 25
- Comprehension 26
- Comprehension 27
- Comprehension 28
- Comprehension 29
- Comprehension 3
- Comprehension 4
- Comprehension 5
- Comprehension 6
- Comprehension 7
- Comprehension 8
- Comprehension 9
- D. Liquid Solutions
- E. Surface Chemistry
- Electrochemistry
- F. Ionic Equilibrium
- G. Chemical Equilibrium
- Gaseous State
- H. Chemical Kinetics
- I.Electrochemistry
- Ionic Equilibrium
- Liquid Solutions
- Match The Column Type
- Multiple Objective Type
- Subjective Type
- Surface Chemistry
- Thermodynamics