Complete Solutions to Electrochemistry of chapter GRAPHICAL INTERPRETATION of Class 12 book with complete answers and questions
| Class 12 | CHEMISTRY |
| Chapter | GRAPHICAL INTERPRETATION |
| GRB PUBLICATION | Electrochemistry |
| Number Of Questions | 9 |
| Academic Year | 2023-24 |
Which of the following curve represents the variation of `lamda_(m)` with `sqrt(C)` for `AgNO_(3)`?
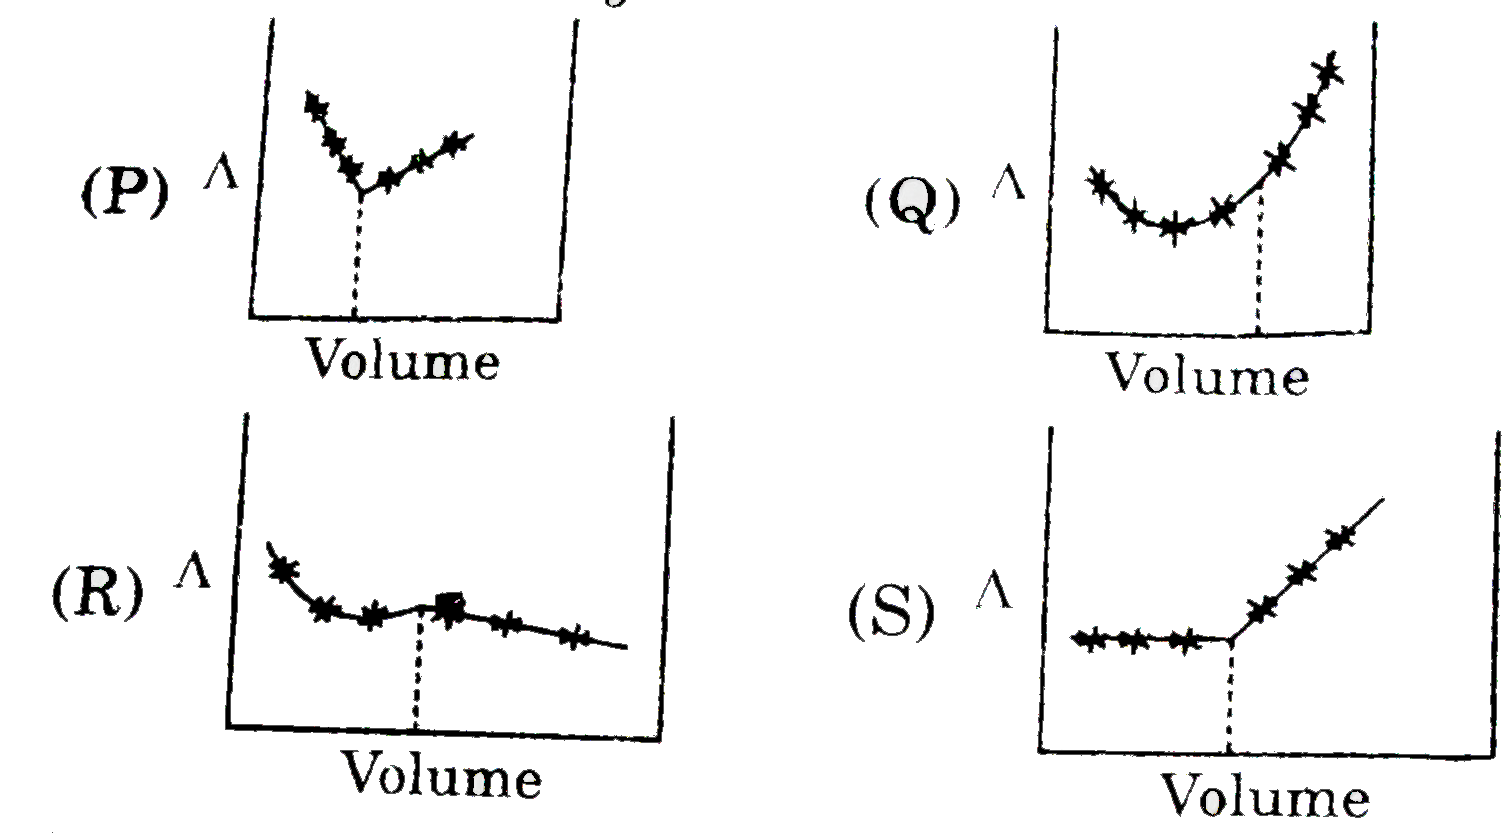
View SolutionConductance measurements and be used to detect the end point of acid-base titrations. Which of the following plots correctly represents the end point of the titration of strong acid and a strong base?
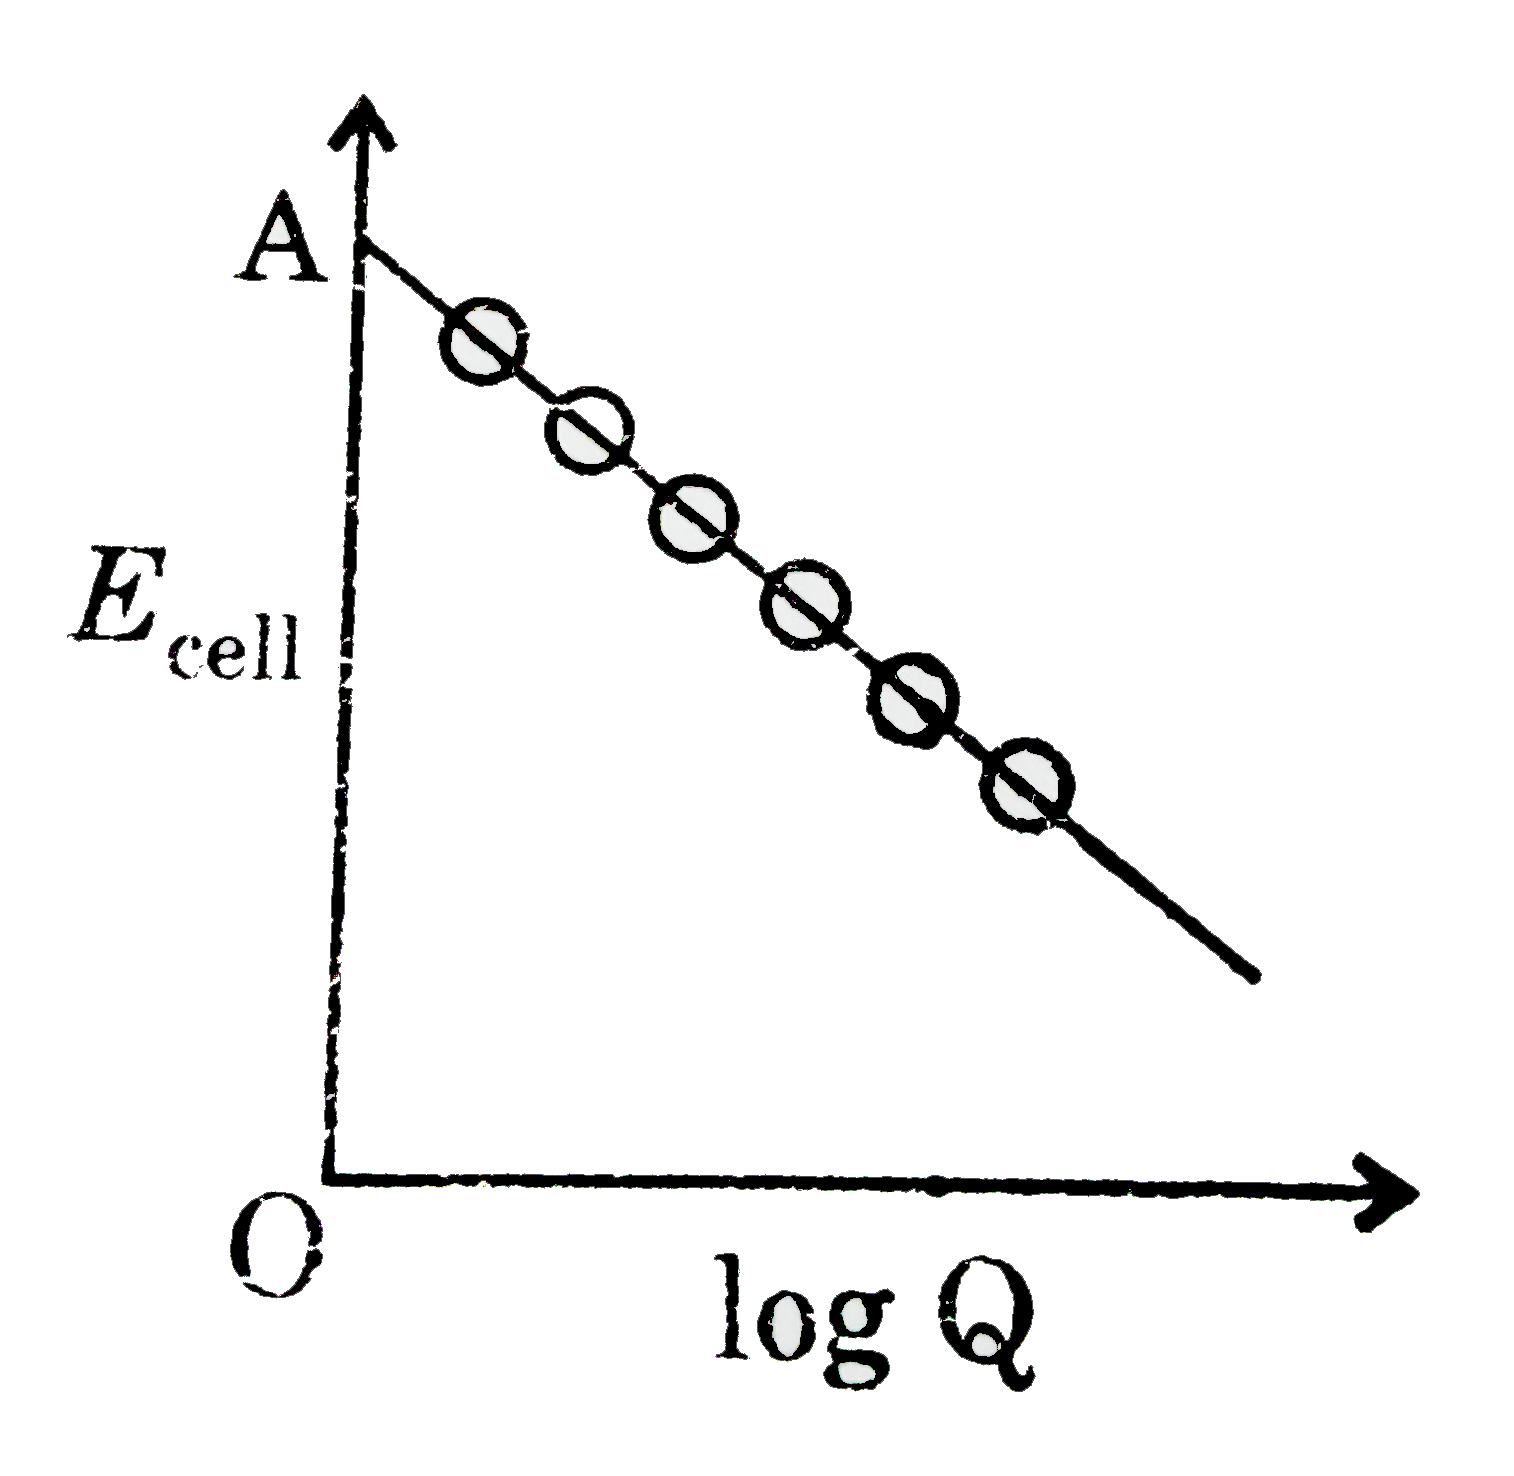
View Solution`Zn+Cu^(2+)(aq)toCu+Zn^(2+)(aq)`.
Reaction quotient is `Q=([Zn^(2+)])/([Cu^(2+)])*E_(cell)^(@)=1.10V` ltb rgt `E_(cell)` will be 1.1591 V when :

View Solution`AgNO_(3)` (aq) was added to an aqueous KCl solution gradually and the conductivity of the solution was measured. The plot of conductance `(^^)` versus the value of `AgNO_(3)` is

View SolutionElectrode potential for Mg electrode varies according to the graph.
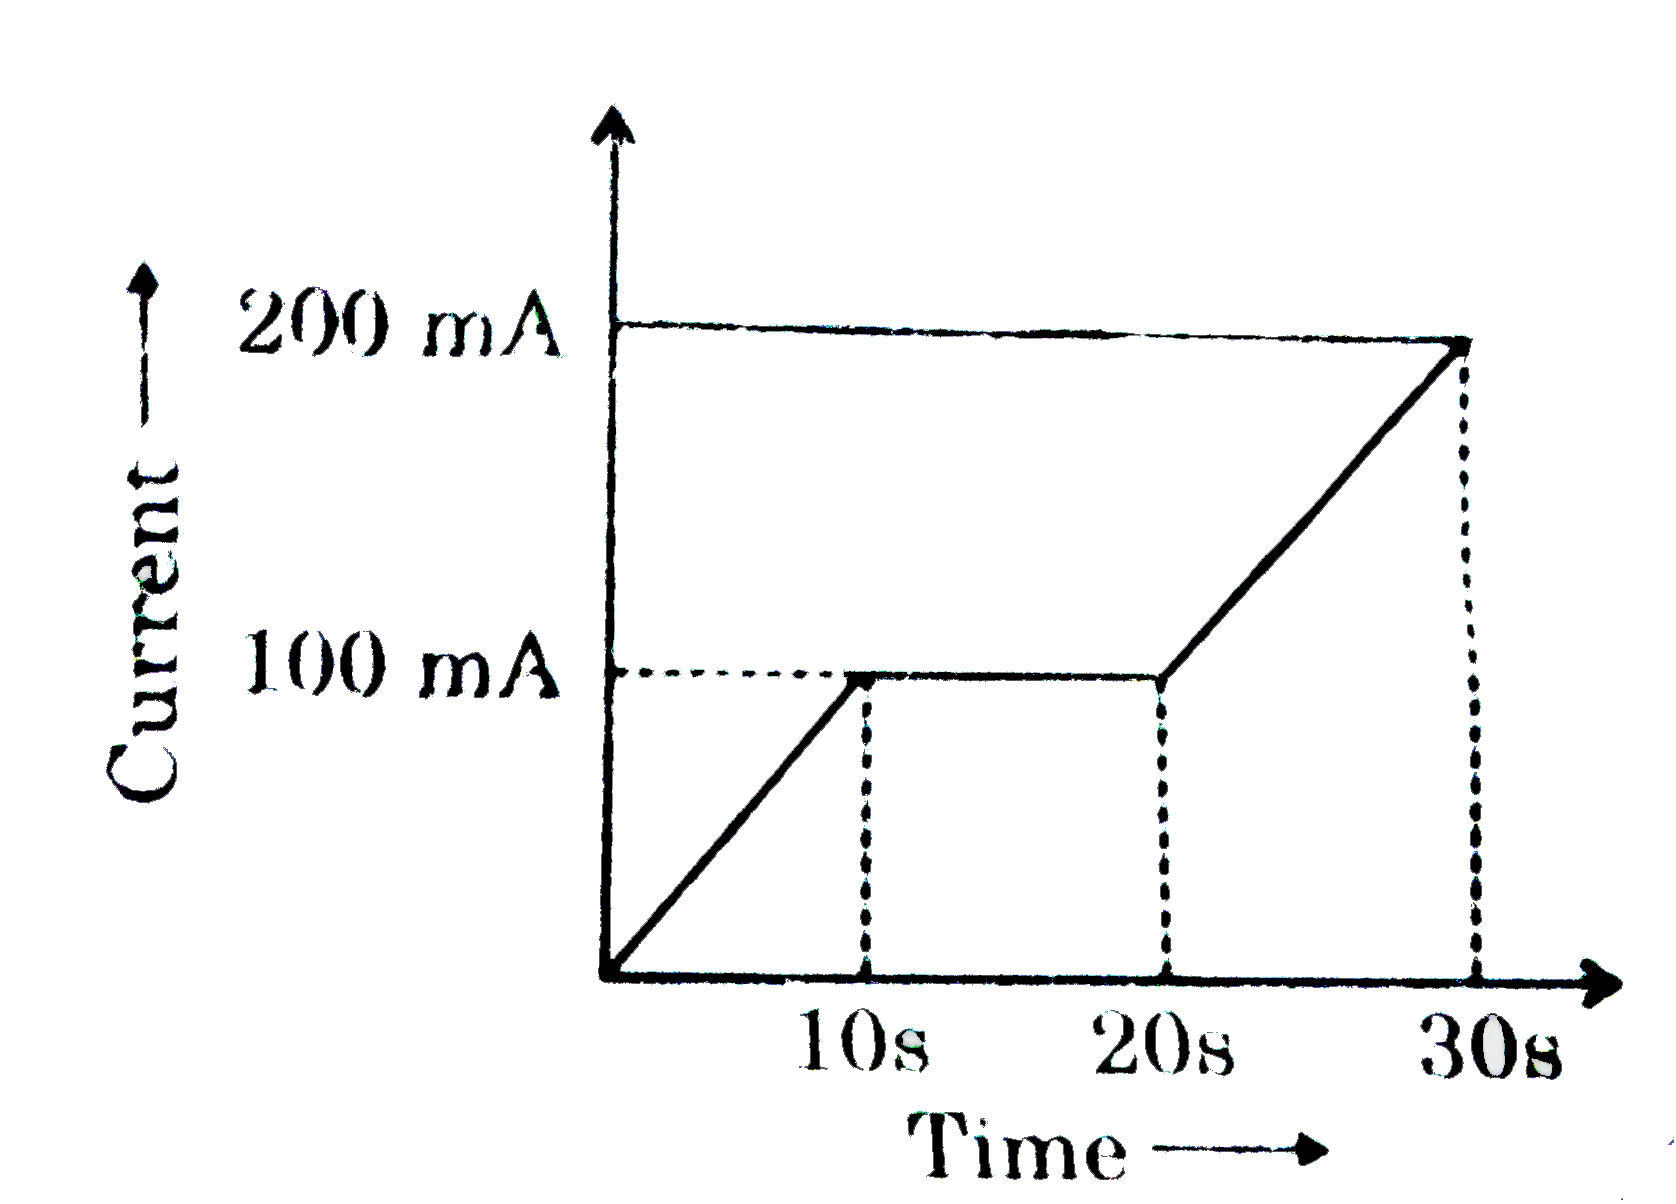
View SolutionIn a Cu-voltameter, mass deposited in 30s is m gm. If the time-current graph is shown in the following figure. What is the electrochemical equivalent of Cu?

View SolutionWhich diagram best represents the change in electrical conductivity of a solution of acetic acid as a solution of sodium hydroxide is added?
View SolutionWhich of the graphs shown below would best represent the changes when 0.10 M barium hydroxide was titrated with 0.10 M sulphuric acid?
View SolutionSelect the correct option for following aqueous solution.
View Solution
Electrochemistry questions and complete solutions for chapter GRAPHICAL INTERPRETATION of GRB CHEMISTRY (HINGLISH) of Class 12
All Exercises from GRB PUBLICATION Class 12 CHEMISTRY GRAPHICAL INTERPRETATION
- A. Thermodynamics
- Atomic Sturcture
- B. Gaseous State
- C. Atomic Sturcture
- Chemical Equilibrium
- Chemical Kinetics
- Comprehension
- Comprehension 1
- Comprehension 10
- Comprehension 11
- Comprehension 12
- Comprehension 13
- Comprehension 14
- Comprehension 15
- Comprehension 16
- Comprehension 17
- Comprehension 18
- Comprehension 19
- Comprehension 2
- Comprehension 20
- Comprehension 21
- Comprehension 22
- Comprehension 23
- Comprehension 24
- Comprehension 25
- Comprehension 26
- Comprehension 27
- Comprehension 28
- Comprehension 29
- Comprehension 3
- Comprehension 4
- Comprehension 5
- Comprehension 6
- Comprehension 7
- Comprehension 8
- Comprehension 9
- D. Liquid Solutions
- E. Surface Chemistry
- Electrochemistry
- F. Ionic Equilibrium
- G. Chemical Equilibrium
- Gaseous State
- H. Chemical Kinetics
- I.Electrochemistry
- Ionic Equilibrium
- Liquid Solutions
- Match The Column Type
- Multiple Objective Type
- Subjective Type
- Surface Chemistry
- Thermodynamics