Complete Solutions to EXERCISE 22 of chapter BAR GRAPHS of Class 7 book with complete answers and questions
| Class 7 | MATHS |
| Chapter | BAR GRAPHS |
| RS AGGARWAL | EXERCISE 22 |
| Number Of Questions | 22 |
| Academic Year | 2023-24 |
The marks of a student in different subjects are given below
Draw a bar graph from the above information
 02:46View Solution
he following table shows the favourite sports of 250 students of a school. Represent the data by a bar graph
 03:10View Solution
Given below is a table which shows the yearwise strength of a school. Represent this data by a bar graph
 04:46View Solution
The following table shows the number of scooters produced by a company during six consecutive years. Draw a bar graph to represent this data
 05:02View Solution
The birth rate per thousand in five countries over a period of time is shown below Country Birth rate per thousand
Represent the above data by a bar graph
 03:48View Solution
The following data shows India's total population (in millions) from 1961 to 2011. Year

Draw the bar graph of given data03:44View SolutionThe following table shows the interest paid by India (in thousand crore rupees) on external debts during the period 1998–99 to 2002-03. Represent the data by a bar graph
 06:07View Solution
The air distances of four cities from Delhi (in km) are given below
Draw a bar graph to represent the above data
 02:58View Solution
The following table shows the life expectancy (average age to which people live) in various countries in a particular year. Represent this data by a bar grap
 04:44View Solution
The following table shows the imports (in thousand crore rupees) made by India over the last five years. Draw a bar graph to represent this data
 04:31View Solution
The data given below shows the average rainfall in Udaipur from June to November of a certain year. Draw a bar graph to represent this information
 02:58View Solution
The following table shows the market position of different brands of soaps. Draw a bar graph to represent this data
 02:48View Solution
Gold prices on 4 consecutive Tuesdays were as under
Draw a bar graph to show this information
 04:29View Solution
Various modes of transport used by 1850 students of a school are given below
Draw a bar graph to represent the above data
 04:08View Solution
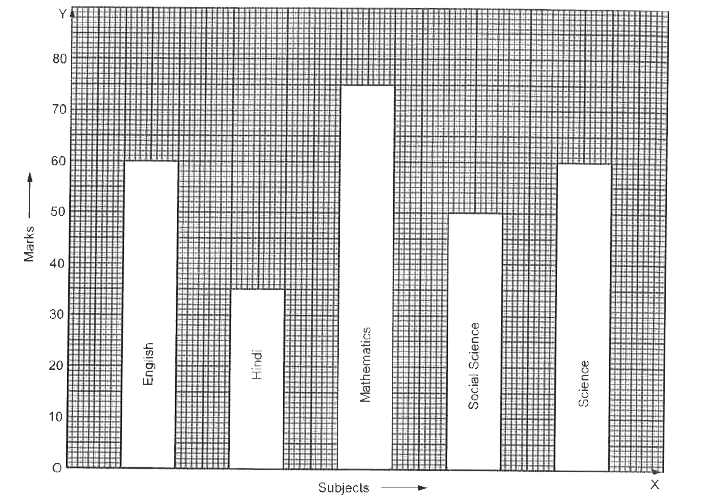
Look at the bar graph given below
Read it carefully and answer the following questions
Q(i) What information does the bar graph give
(ii) In which subject is the student very good
(iii) In which subject is he poor
(iv) What is the average of his marks
 03:51View Solution
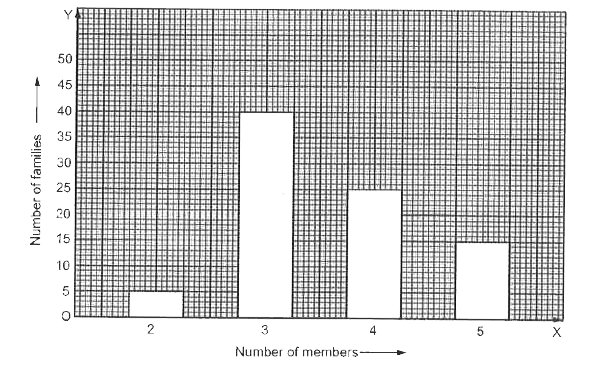
In a survey of 85 families of a colony, the number of members in each family was recorded and the data has been represented by the following bar graph
Read the bar graph carefully and answer the questions given below
Q (i) What information does the bar graph give
(ii) How many families have 3 members
(iii) How many people live alone
(iv) Which type of family is the most common? How many members are there in each family of this kind
 07:08View Solution
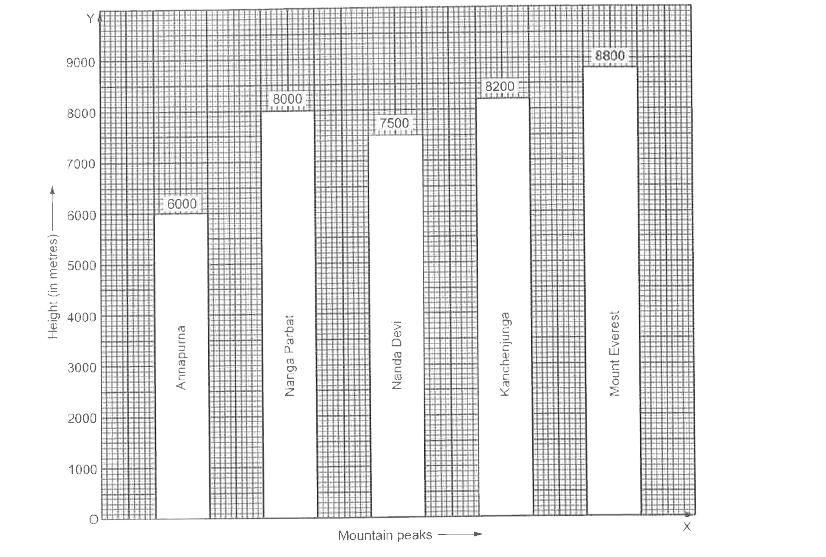
Given below is a bar graph showing the heights of five mountain peaks
Read the bar graph carefully and answer the following questions
Q(i) Which is the highest peak and what is its height (ii) What is the ratio of the heights of the highest peak and the next highest peak (iii) Arrange the heights of the given peaks in descending order
 06:12View Solution
In a public library, the following observations were recorded by the librarian in a particular week:

(a) Draw a double bar graph choosing an appropriate scale.
(b) On which day, the number of readers in the library was maximum?
(c) What is the mean number of magazine readers?06:47View SolutionOn a particular day in a school, the attendance in each of the classes from VI to X has been recorded as under
Draw a double bar graph, choosing an appropriate scale. Using the bar graph, answer the questions given below

(i) Which class has the maximum number of students (ii) Find the ratio of number of students present to the total number of students in Class VII. (iii) What percent of Class IX students were absent05:22View SolutionConsider the data, showing the average daily hours of sunshine in two cities Aberdeen and Margate for six months of an year Draw a double bar graph, to depict the above information

(i) In which month does Aberdeen have maximum sunlight?
(ii) In which month does Margate have minimum sunlight?05:50View SolutionThe table given below shows the population of four towns over two years
Q (i)The table given below shows the population of four towns over two years
(ii) In which town was the population growth maximum
(iii) In which town was the population growth least
Hint Take 1 unit = 1 lakh people
 07:28View Solution
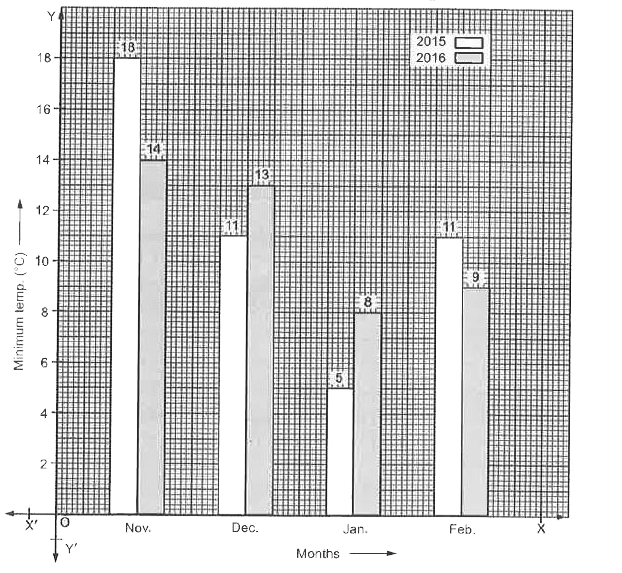
Study the double bar graph given below and answer the questions that follow
Q(i) What has been compared in the given double bar graph
(ii) What is the ratio of minimum temperatures in the year 2015 to the year 2016 in the month of November
(iii) Name the months in which the minimum temperature in 2015 was greater than that in 2016
(iv) Find the average minimum temperature for the year 2016 for the given four months
(v) In which month is the variation in two temperatures maximum
 11:45View Solution
EXERCISE 22 questions and complete solutions for chapter BAR GRAPHS of RS AGGARWAL MATHS (HINGLISH) of Class 7
