he following table shows the favourite sports of 250 students of a school. Represent the data by a bar graph

Step by step video & image solution for he following table shows the favourite sports of 250 students of a school. Represent the data by a bar graph by Maths experts to help you in doubts & scoring excellent marks in Class 7 exams.
Updated on:21/07/2023Topper's Solved these Questions
- BAR GRAPHSBOOK - RS AGGARWALCHAPTER - BAR GRAPHSEXERCISE - EXERCISE 22
22 Videos
- ALGEBRAIC EXPRESSION BOOK - RS AGGARWALCHAPTER - ALGEBRAIC EXPRESSION EXERCISE - EXERCISE 6D
31 Videos
- COLLECTION AND ORGANISATION OF DATA (MEAN, MEDIAN AND MODE)BOOK - RS AGGARWALCHAPTER - COLLECTION AND ORGANISATION OF DATA (MEAN, MEDIAN AND MODE)EXERCISE - EXERCISE 21C
5 Videos
Similar Questions
The following table shows the interest of students of a school in different games :

Represent the data by using a simple bar diagram.
View SolutionThe following table shows the favourite games of 240 students of a school. Draw a pie chart for the following data.
¯¯¯¯¯¯¯¯¯¯¯¯¯¯¯¯¯¯¯¯¯¯¯¯¯¯¯¯¯¯¯¯¯¯¯¯¯¯¯¯¯¯¯¯¯¯¯¯¯¯¯¯¯¯¯¯¯¯¯¯¯¯¯¯¯¯¯¯¯¯¯¯¯¯¯¯¯¯¯¯¯¯¯¯¯¯¯¯¯¯¯¯¯¯¯¯¯¯¯¯¯¯¯¯¯¯¯¯¯¯¯¯¯¯¯¯¯¯¯¯Game Football Badminton Criket Volleyball HockeyNumber of 35 30 80 40 55students ––––––––––––––––––––––––––––––––––––––––––––––––––––––––––––––––––––––––––––––
View Solution. The following data shows the year wise strength of a school.Represent the the above data by bar graph:
View SolutionThe following table shows the number of fruits in a fruit shop. Represent the above data by a bar graph
View SolutionThe following data shows the number of students who attended the school on weekdays. Draw a bar graph to represent information by using appropriate scale.

View SolutionThe following table shows various sports played by students in a school. Draw a pie chart to represent the given data.
SportsChessCricketCarromsFootballNumber of students35704263
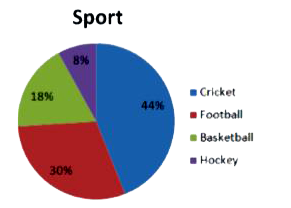
View SolutionThe given pie-chart shows favourite sport of students of a school.

In the given pie-chart, if there were 1280 students in all, how many liked football?
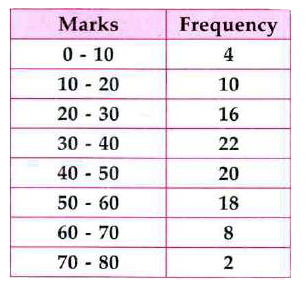
View SolutionThe following table gives the marks scored by 100 students in an entrance examination

Represent this data in the form of a histogram.
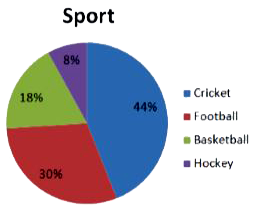
View SolutionThe given pie-chart shows favourite sport of students of a school.

In the given pie-chart, what is the difference in percentage between liking for football and basketball?
View SolutionThe following table shows the marks obtained by 100 students of a class in a school during a particular academic session. Find the modal marks.

View Solution
