The number of cycles produced in a factory during five consecutive weeks is given below
Draw a bar graph representing the above information

Step by step video & image solution for The number of cycles produced in a factory during five consecutive weeks is given belowDraw a bar graph representing the above information by Maths experts to help you in doubts & scoring excellent marks in Class 7 exams.
Updated on:21/07/2023Topper's Solved these Questions
- BAR GRAPHSBOOK - RS AGGARWALCHAPTER - BAR GRAPHSEXERCISE - EXERCISE 22
22 Videos
- ALGEBRAIC EXPRESSION BOOK - RS AGGARWALCHAPTER - ALGEBRAIC EXPRESSION EXERCISE - EXERCISE 6D
31 Videos
- COLLECTION AND ORGANISATION OF DATA (MEAN, MEDIAN AND MODE)BOOK - RS AGGARWALCHAPTER - COLLECTION AND ORGANISATION OF DATA (MEAN, MEDIAN AND MODE)EXERCISE - EXERCISE 21C
5 Videos
Similar Questions
Given here is a bar graph showing the number of cycles produced in a factory during five consecutive weeks.
Observe the graph and answer the questions based on this graph.
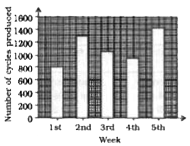
The number of cycles produced in the 5th week is
View SolutionThe number of Mathematics books sold by a shopkeeper on six consecutive days is shown below Draw a bar graph to represent the above information choosing the scale of your choice.
View Solution
Knowledge Check
Given below is the bar graph showig the number of scooters produced in a factory during the first five months of a year.
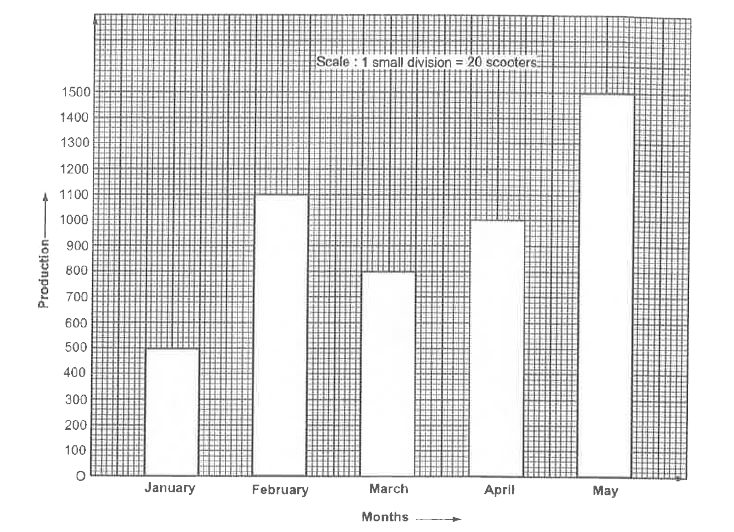
Read the above bar graph carefully nd answer the question given below:
How many scooters were produced in the month of March?
What was the increase in proudction in Feberuary over the production in January ?
What was teh decrease in proudction in March in comparison to the production in February ?
In which month was the production minimum and what was it ?A(i) 800 scooters
(ii) 600 scooters
(iii) 300 scooters less in March
(iv) Minimum production in january =500B(i) 700 scooters
(ii) 500 scooters
(iii) 300 scooters less in March
(iv) Minimum production in january =500C(i) 900 scooters
(ii) 600 scooters
(iii) 300 scooters less in March
(iv) Minimum production in january =200D(i) 750 scooters
(ii) 550 scooters
(iii) 300 scooters less in March
(iv) Minimum production in january =500
The number of Mathematics books sold by a shopkeeper on six consecutive days is shown below :
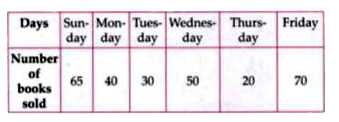
Draw a bar graph to represent the above information choosing the scale of your choice.
View SolutionHome appliances sold by a shop in one month are given as below:
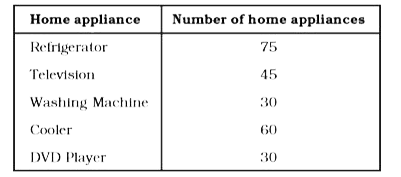
Draw a bar graph to represent the above information.
View SolutionNumber of mobile phone users in various age groups in a city is listed below:

Draw a bar graph to represent the above information.
View SolutionThe lengths in km (rounded to nearest hundred) of some major rivers of India is given below:
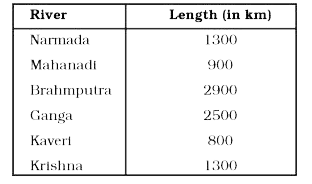
Draw a bar graph to represent the above information.
View SolutionThe given table shows the number of tourists who visited Taj Mahal during different months. Month

Draw a bar graph to represent the above information by using appropriate scale.
View SolutionThe number of ATMs of different banks in a city is shown below:
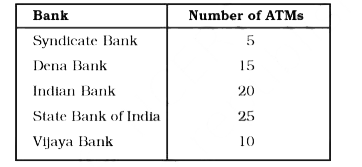
Draw a bar graph to represent the above information by choosing the scale of your choice.
View SolutionThe expenditure of a family of different heads in a month is given below

Draw a bar graph to represent the data above.
View Solution
