The following table shows the annual export of an Indian company during five consecutive years (in crores of rupees)
Draw a bar graph representing the above data

Step by step video & image solution for The following table shows the annual export of an Indian company during five consecutive years (in crores of rupees)Draw a bar graph representing the above data by Maths experts to help you in doubts & scoring excellent marks in Class 7 exams.
Updated on:21/07/2023Topper's Solved these Questions
- BAR GRAPHSBOOK - RS AGGARWALCHAPTER - BAR GRAPHSEXERCISE - EXERCISE 22
22 Videos
- ALGEBRAIC EXPRESSION BOOK - RS AGGARWALCHAPTER - ALGEBRAIC EXPRESSION EXERCISE - EXERCISE 6D
31 Videos
- COLLECTION AND ORGANISATION OF DATA (MEAN, MEDIAN AND MODE)BOOK - RS AGGARWALCHAPTER - COLLECTION AND ORGANISATION OF DATA (MEAN, MEDIAN AND MODE)EXERCISE - EXERCISE 21C
5 Videos
Similar Questions
The income of a family i different year are as follows. Draw a bar graph to represent the data
View SolutionThe given table shows the number of tourists who visited Taj Mahal during different months. Month

Draw a bar graph to represent the above information by using appropriate scale.
View SolutionThe following table shows the number of fruits in a fruit shop. Represent the above data by a bar graph
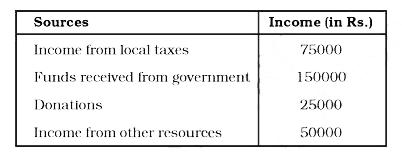
View SolutionThe following table represents income of a Gram Panchayat from different sources in a particular year:

Draw a bar graph to represent the above information
View SolutionThe expenditure of a family of different heads in a month is given below

Draw a bar graph to represent the data above.
View SolutionThe following data shows the number of students who attended the school on weekdays. Draw a bar graph to represent information by using appropriate scale.

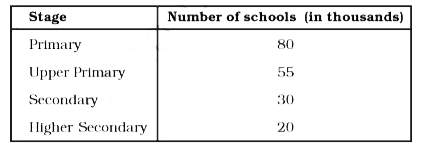
View SolutionThe following table gives the data of number of schools (stage-wise) of a country in the year 2002.

Draw a bar graph to represent the above data:
View SolutionGiven below is the data of school going students (boys and girls):

Draw the bar graph to represent the above data.
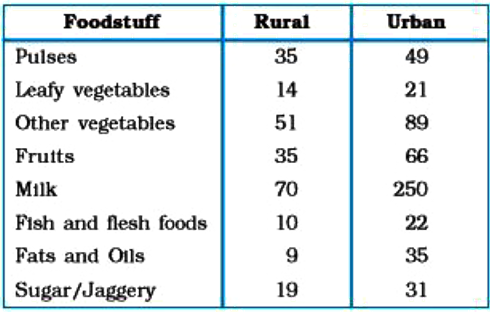
View SolutionThe following table shows the average intake of nutrients in calories by rural and urban groups in a particular year. Using a suitable scale for the given data, draw a double bar graph to compare the data.

View SolutionThe number of Mathematics books sold by a shopkeeper on six consecutive days is shown below Draw a bar graph to represent the above information choosing the scale of your choice.
View Solution
