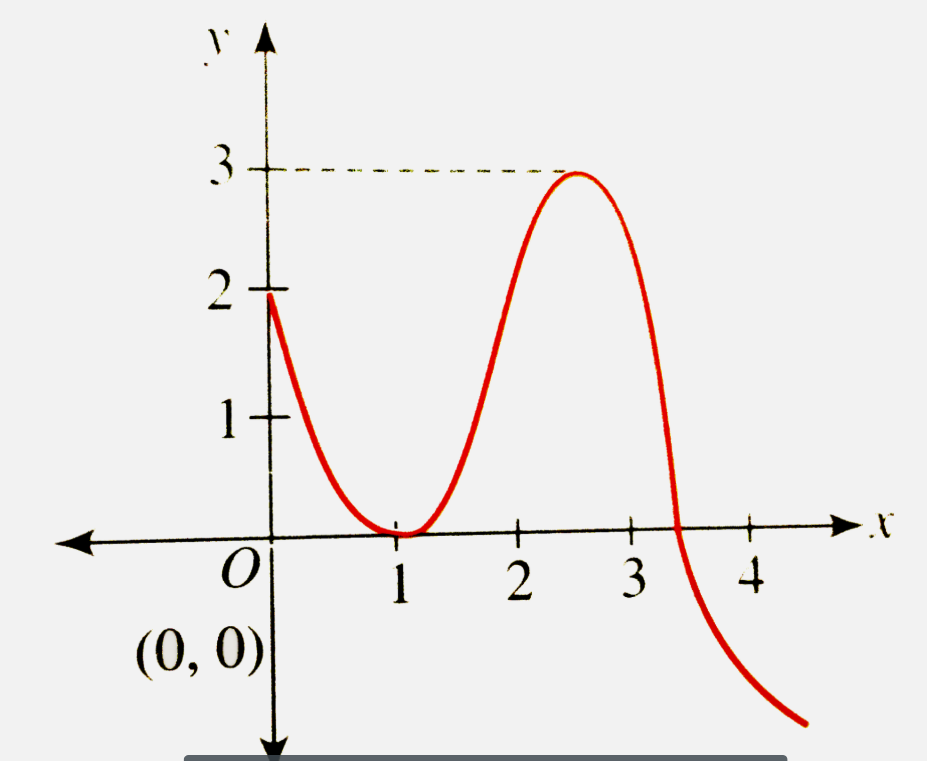
The diagram shows the graph of the derivative of a functin f(x) for with f(0) = 0. Which of the following could be correct statements for y = f(x)?
sec^(-1) sqrt 5 with the x - axis.
(b) f is increasing in (0, 3).
(c) x = 1 is both an inflection point and the point of local extremum.
(d) Number of critical point on y = f(x) is two.
Slope of y tangent at .
Hence (a) is correct.
, hence f is increasing for (0, 3) , and so (b) is correct.
The x - axis is tangent to the curve at x = 1, therefore f''(1) = 0.
So x = 1 is point of inflection, but not the point of extremum as the sign of f'(x) does not change at x = 1.
Hence (c) is not correct.
Obviously, y = f(x) has two critical points as f'(1) = 0 and f'(3.5) = 0.
Topper's Solved these Questions
- GETTING STARTED WITH GRAPHSBOOK - CENGAGECHAPTER - GETTING STARTED WITH GRAPHSEXERCISE - Exercise
18 Videos
- FUNCTIONSBOOK - CENGAGECHAPTER - FUNCTIONSEXERCISE - Question Bank
30 Videos
- GRAPH OF INVERSE TRIGONOMETRIC FUNCTIONSBOOK - CENGAGECHAPTER - GRAPH OF INVERSE TRIGONOMETRIC FUNCTIONSEXERCISE - Exercise
18 Videos
Similar Questions
The diagram shows the graph of the derivative of a functin f(x) for 0≤x≤4 with f(0) = 0. Which of the following could be correct statements for y = f(x)?

(a) Tangent line to y = f(x) at x = 0 makes an angle of sec−1√5 with the x - axis.
(b) f is increasing in (0, 3).
(c) x = 1 is both an inflection point and the point of local extremum.
(d) Number of critical point on y = f(x) is two.
View SolutionDoes the graph below represent a function or a relation?
(##CEN_GRA_C01_S01_002_Q01.png" width="80%">
View Solution
Knowledge Check
In figure ,PR = ?
(##CEN_JEE_MAT_X_C14_E01_032_Q01.png" width="80%">A20 cmB22 cmC24 cmD26 cm
Following is the graph of y = f(x).
(##CENGRAC01S01005_Q01.png width=80%><br>F∈dthes√oftheequation f(x) = 0, f(x) = 4 and f(x) = 10.
View SolutionThe graph of y = f(x) is shown, find the number of solution of f(f(x)) = 2.
(##CEN_GRA_C01_S01_007_Q01.png" width="80%">
View SolutionThe graph of the second derivation f''(x) is given in the following figure. State the x - coordinate of the point of inflection of f. Given reasons for your answer.
(##CEN_GRA_C01_S01_024_Q01.png" width="80%">
View SolutionThe figure shows the graphs of f, f' and f'' . Identify each curve and explain your choices.
(##CEN_GRA_C01_S01_025_Q01.png" width="80%">
View SolutionThe graph of y=f(x) is as shown in the following figure.
(##CEN_GRA_C01_S01_016_Q01.png" width="80%">
Identify the points of discontinuity and give the reason for the same.
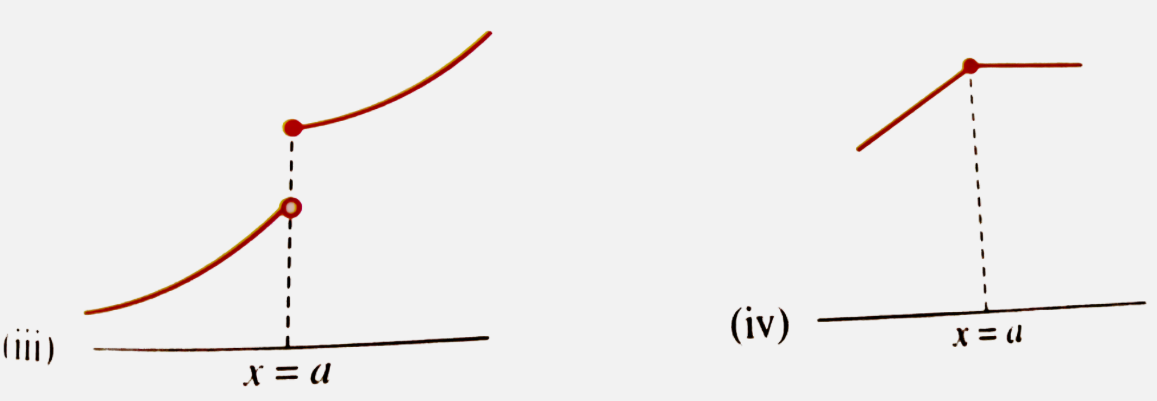
View SolutionFor each of the following graphs, comment whether f(x) is increasing or decreasing or neither increasing nor decreasing at x = a.
(##CEN_GRA_C01_S01_018_Q01.png" width="80%">

View SolutionIn the following graph, state the absolute and local maximum and minimum values of the function.
(##CEN_GRA_C01_S01_022_Q01.png" width="80%">
View Solution
