Consider the data, showing the average daily hours of sunshine in two cities Aberdeen and Margate for six months of an year Draw a double bar graph, to depict the above information

(i) In which month does Aberdeen have maximum sunlight?
(ii) In which month does Margate have minimum sunlight?
Step by step video & image solution for Consider the data, showing the average daily hours of sunshine in two cities Aberdeen and Margate for six months of an year Draw a double bar graph, to depict the above information (i) In which month does Aberdeen have maximum sunlight? (ii) In which month does Margate have minimum sunlight? by Maths experts to help you in doubts & scoring excellent marks in Class 7 exams.
Updated on:21/07/2023Topper's Solved these Questions
- BAR GRAPHSBOOK - RS AGGARWALCHAPTER - BAR GRAPHSEXERCISE - EXERCISE 22
22 Videos
- ALGEBRAIC EXPRESSION BOOK - RS AGGARWALCHAPTER - ALGEBRAIC EXPRESSION EXERCISE - EXERCISE 6D
31 Videos
- COLLECTION AND ORGANISATION OF DATA (MEAN, MEDIAN AND MODE)BOOK - RS AGGARWALCHAPTER - COLLECTION AND ORGANISATION OF DATA (MEAN, MEDIAN AND MODE)EXERCISE - EXERCISE 21C
5 Videos
Similar Questions
The table below compares the population (in hundreds) of 4 towns over two years:

Study the table and answer the following questions:
(a) Draw a double bar graph using appropriate scale to depict the above information.
(b) In which town was the population growth maximum?
(c) In which town was the population growth least?
View SolutionThe data given below shows the production of motor bikes in a factory for some months of two consecutive years.

Study the table given above and answer the following questions:
(a) Draw a double bar graph using appropriate scale to depict the above information and compare them.
(b) In which year was the total output the maximum?
(c) Find the mean production for the year 2007.
(d) For which month was the difference between the production for the two years the maximum?
(e) In which month for the year 2008, the production was the maximum?
(l) In which month for the year 2007, the production was the least?
View SolutionThe table below gives the data of tourists visiting 5 hill stations over two consecutive years. Study the table and answer the questions that follow:

(a) Draw a double bar graph to depict the above information using appropriate scale.
(b) Which hill station was visited by the maximum number of tourists in 2008?
(c) Which hill station was visited by the least number of tourists in 2009?
(d) In which hill stations was there increase in number of tourists in the year 2009?
View SolutionThe students of Class VII have to choose one club from Music, Dance, Yoga, Dramatics, Fine arts and Electronics clubs. The data given below shows the choices made by girls and boys of the class. Study the table and answer the questions that follow:

(a) Draw a double bar graph using appropriate scale to depict the above data.
(b) How many students are there in Class VII?
(c) Which is the most preferred club by boys?
(d) Which is the least preferred club by girls?
(e) For which club the difference between boys and girls is the least?
(f) For which club is the difference between boys and girls the maximum?
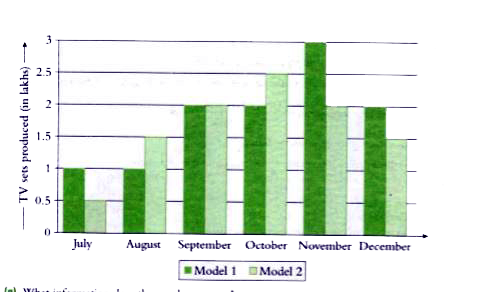
View SolutionTwo different models of TV sets are produced in a factory and are given below as a double bar graph. Read the data and answer the following questions:

In which month, both the models of TV secs produced are maximum?
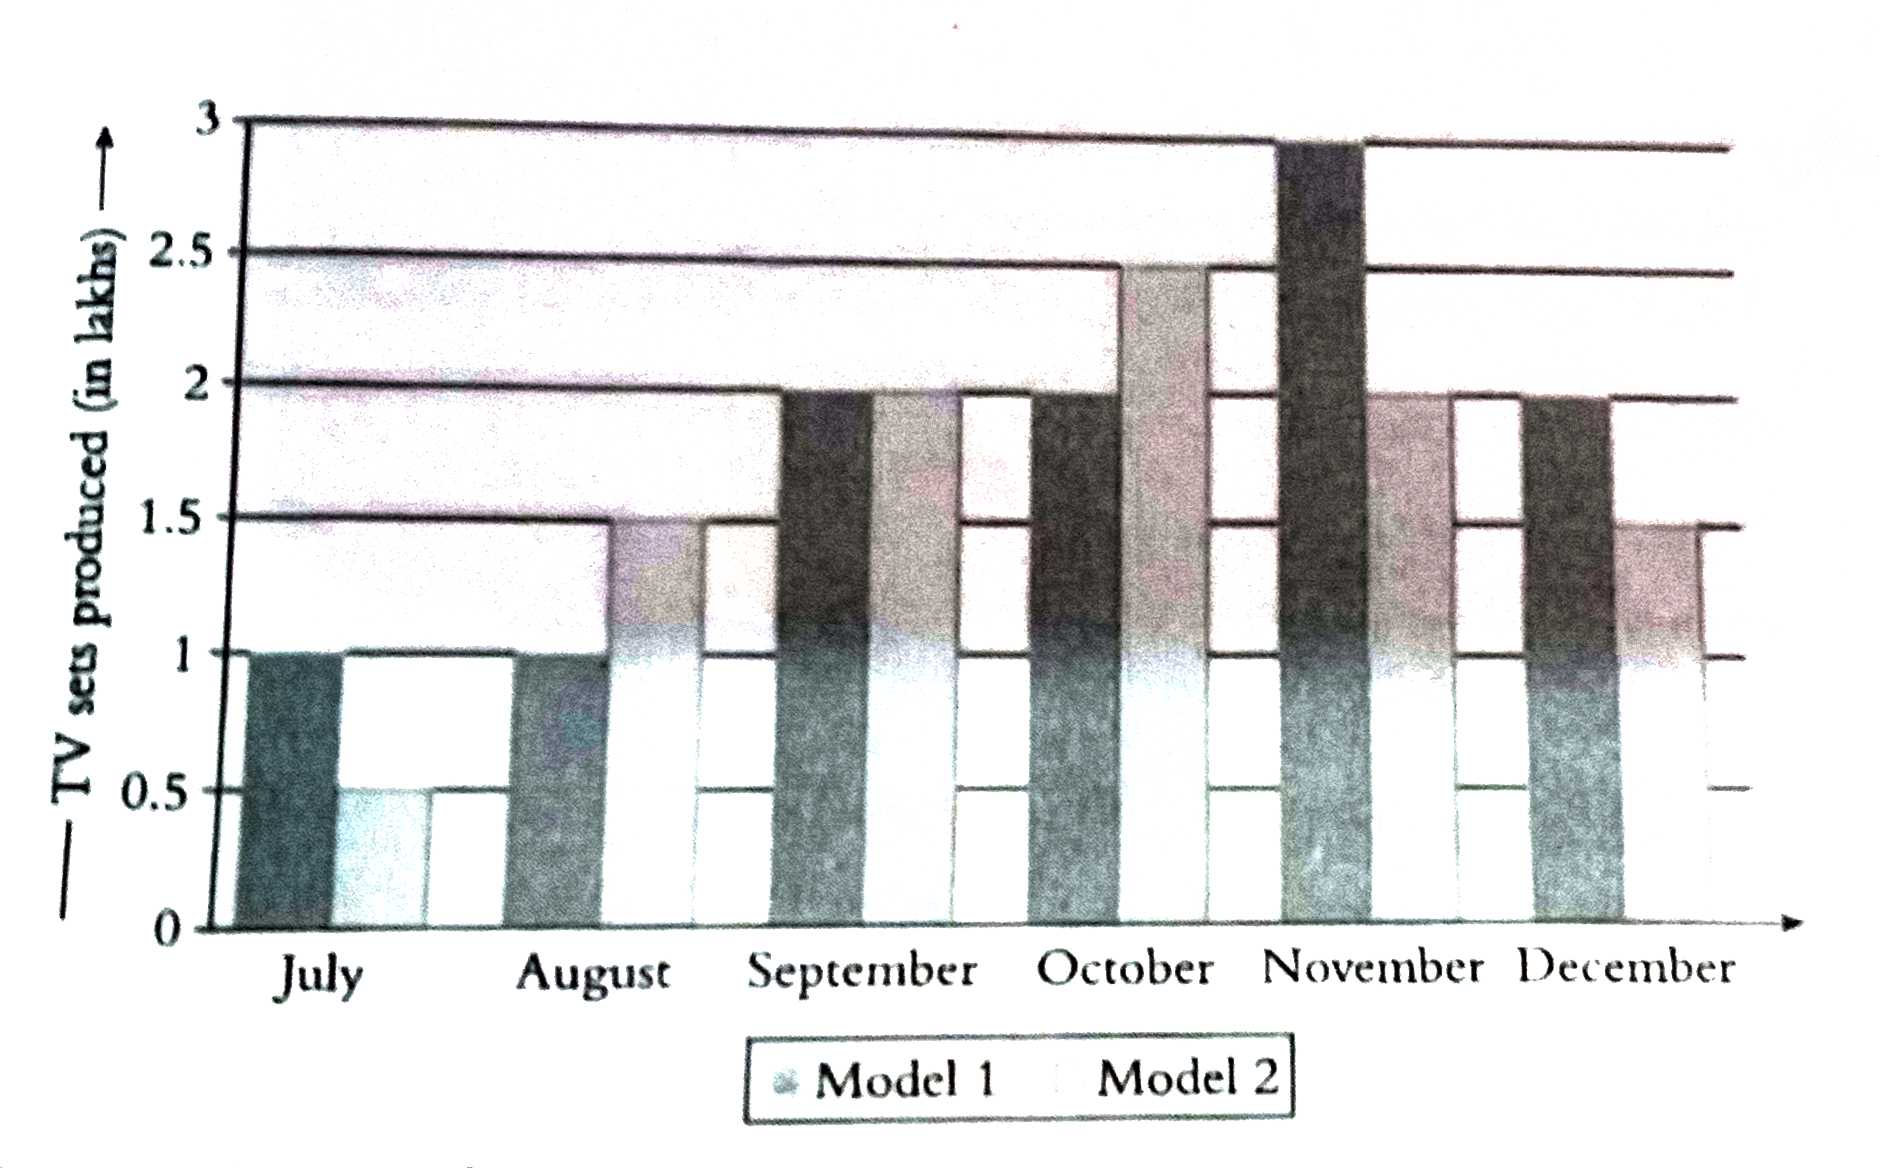
View SolutionTwo different models of TV sets are produced in a factory and are given below as a double bar graph. Read the data and answer the following questions :

(A) What information does the graph represent ?
(b) In which month, both the models of TV sets produced are equal ?
(c) In which month, both the model of TV sets produced are maximum ?
(d) In which month, both the models of TV sets produced are minimum and how many are they ?
View SolutionThe daily maximum and minimum temperature of a city during one week in the month a April is given below. Construct a double bar graph using this data

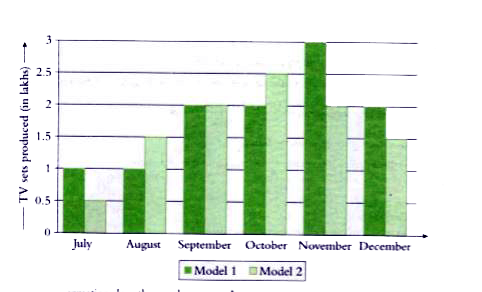
View SolutionTwo different models of TV sets are produced in a factory and are given below as a double bar graph. Read the data and answer the following questions:

In which month, both the models of TV sets produced are minimum and how many are they?
View SolutionIn a particular section of Class IX,40 students were asked about the months of their birth and the following graph was prepared for the data so obtained:Observe the bar graph given above and answer the following questions:
(i) How many students were born in the month of November? (ii) In which month were the maximum number of students born?
View SolutionRead the following information:
(i) Resistivity of copper is lower than that of aluminium which, in turn, is lower than that of constantan.
(ii) Six wires labelled as A, B, C, D, E, F have been designed as per the following parameters:


Answer the following questions using the above data:
(a) Which of the wires has maximum resistance and why?
(b) Which of the wires has minimum resistance and why?
(c) Arrange R1,R3 and R5 in ascending order of their values. Justify your answer.
View Solution
