Given below is a bar graph showing the heights of five mountain peaks
Read the bar graph carefully and answer the following questions
Q(i) Which is the highest peak and what is its height (ii) What is the ratio of the heights of the highest peak and the next highest peak (iii) Arrange the heights of the given peaks in descending order
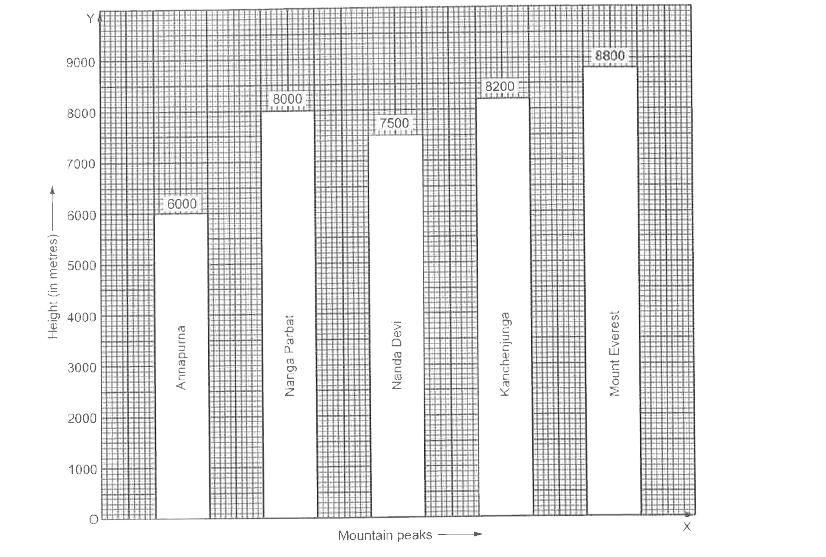
The correct Answer is:(ii) 44:41
(iii) 6000 m
Step by step video, text & image solution for Given below is a bar graph showing the heights of five mountain peaksRead the bar graph carefully and answer the following questionsQ(i) Which is the highest peak and what is its height (ii) What is the ratio of the heights of the highest peak and the next highest peak (iii) Arrange the heights of the given peaks in descending order by Maths experts to help you in doubts & scoring excellent marks in Class 7 exams.
Updated on:21/07/2023Topper's Solved these Questions
- BAR GRAPHSBOOK - RS AGGARWALCHAPTER - BAR GRAPHSEXERCISE - EXERCISE 22
22 Videos
- ALGEBRAIC EXPRESSION BOOK - RS AGGARWALCHAPTER - ALGEBRAIC EXPRESSION EXERCISE - EXERCISE 6D
31 Videos
- COLLECTION AND ORGANISATION OF DATA (MEAN, MEDIAN AND MODE)BOOK - RS AGGARWALCHAPTER - COLLECTION AND ORGANISATION OF DATA (MEAN, MEDIAN AND MODE)EXERCISE - EXERCISE 21C
5 Videos
Similar Questions
Given below is a bar graph showing the heights of five mountain peaks
Read the bar graph carefully and answer the following questions
Q(i) Which is the highest peak and what is its height (ii) What is the ratio of the heights of the highest peak and the next highest peak (iii) Arrange the heights of the given peaks in descending order

View SolutionA bar graph showing the heights of six mountain peaks is given below. Study the bar graph and answer the questions.
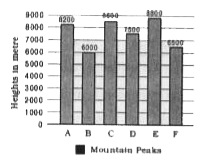
Which peak is the second highest ?
View Solution
Knowledge Check
The bar graph shows the population of different countries. Study the diagram and answer the following questions.
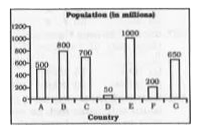
Which country has the second highest population?ABBDCEDAWhat is the height of Kanchenjunga, the highest peak in the Indian Himalayan range?
A7345 mB8498 mC8398 mD8598 m
A bar graph showing the heights of six mountain peaks is given below. Study the bar graph and answer the questions.
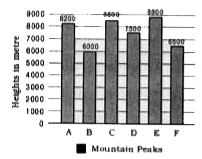
The average hight of all the peaks (in metre) is
View SolutionA bar graph showing the heights of six mountain peaks is given below. Study the bar graph and answer the questions.
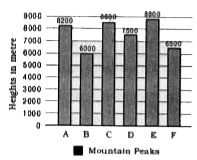
When the heights of the given peaks are written in ascending order, what is the average of the middle two peaks?
View SolutionA bar graph showing the heights of six mountain peaks is given below. Study the bar graph and answer the questions.
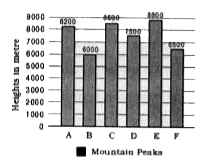
What is the respective ratio of the heights of the highest peak and the lowest peak?
View SolutionRead the bar graph given below and answer the following questions:
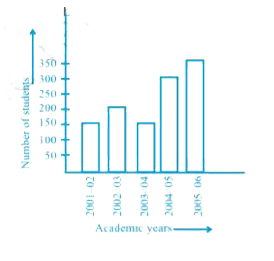
What information is given by the þar graph?
View SolutionRead the bar graph given below and answer the following questions.
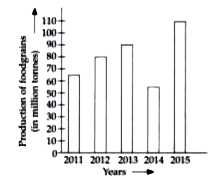
What is the ratio of the production of foodgrains in 2011 to that in 2014?
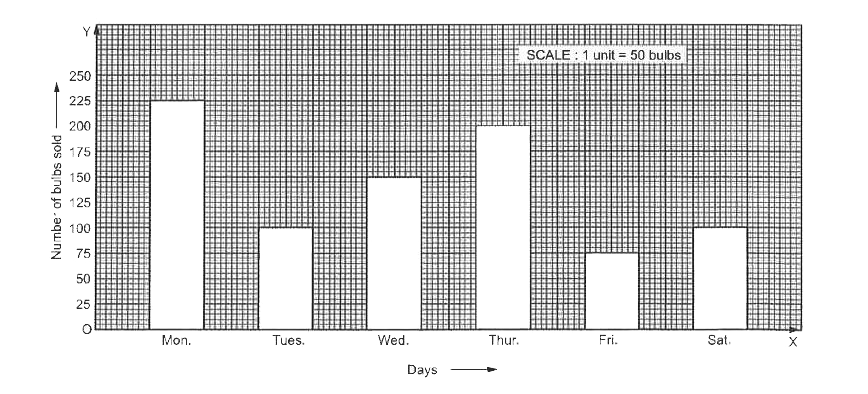
View SolutionGiven below is a graph showing the number of electric bulbs sold in a shop during a week
Read the bar graph carefully and answer the following questions
(i) On which day of the week was the sale minimum?
(ii) On which day of the week was the sale maximum
(iiI) What was the total sale during the week
(lv) What is the ratio between the minimum sale and the maximum sale
View Solution
