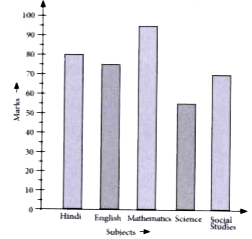
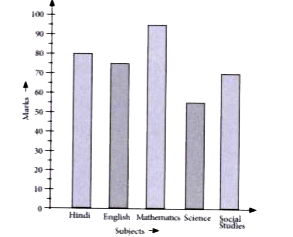
The marks obtained by Kunal in his annual examination are shown below:
Draw a bar graph to represent the above data

Step by step video & image solution for The marks obtained by Kunal in his annual examination are shown below:Draw a bar graph to represent the above data by Maths experts to help you in doubts & scoring excellent marks in Class 7 exams.
Updated on:21/07/2023Topper's Solved these Questions
- BAR GRAPHSBOOK - RS AGGARWALCHAPTER - BAR GRAPHSEXERCISE - EXERCISE 22
22 Videos
- ALGEBRAIC EXPRESSION BOOK - RS AGGARWALCHAPTER - ALGEBRAIC EXPRESSION EXERCISE - EXERCISE 6D
31 Videos
- COLLECTION AND ORGANISATION OF DATA (MEAN, MEDIAN AND MODE)BOOK - RS AGGARWALCHAPTER - COLLECTION AND ORGANISATION OF DATA (MEAN, MEDIAN AND MODE)EXERCISE - EXERCISE 21C
5 Videos
Similar Questions
The following table shows the marks obtained by Sumit in the annual examination.

Draw a bar graph to show the above information.
View SolutionDraw a pictograph to represent the data given below :

View SolutionThe bar graph shows the marks obtained by Kashish in half-yearly examination in various subjects.

Draw a pictograph for the above data and then answer the following questions.
Name the subjects in which Kashish scored minimum and maximum marks.
View SolutionThe bar graph shows the marks obtained by Kashish in half-yearly examination in various subjects.

Draw a pictograph for the above data and then answer the following questions.
Find the total marks scored by Kashish.
View SolutionThe marks obtained by 200 students in an examination are given below. : Draw a less than ogive for the above distribution and use less than ogive to find median.
View SolutionThe following table shows the marks secored by a student in annual examination in various subjects. Draw a histogram to represent the given data.
SubjectTeluguHindiEnglishMathsScienceSocial StudiesMarks807482949088
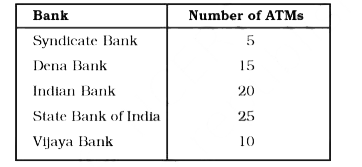
View SolutionThe number of ATMs of different banks in a city is shown below:

Draw a bar graph to represent the above information by choosing the scale of your choice.
View SolutionThe marks scored by students in Mathematics in a certain examinations are given below:

Draw histogram for the above data.
View SolutionThe marks scored by students in Mathematics in a certain examinations are given below:

Draw histogram for the above data.
View SolutionThe marks obtained by a student in an examination are given below:

Represent the data using pie diagram.
View Solution
